Get cTrader
Start trading
cBots
Indicators
Plugins
Brokers & Props
Indicator
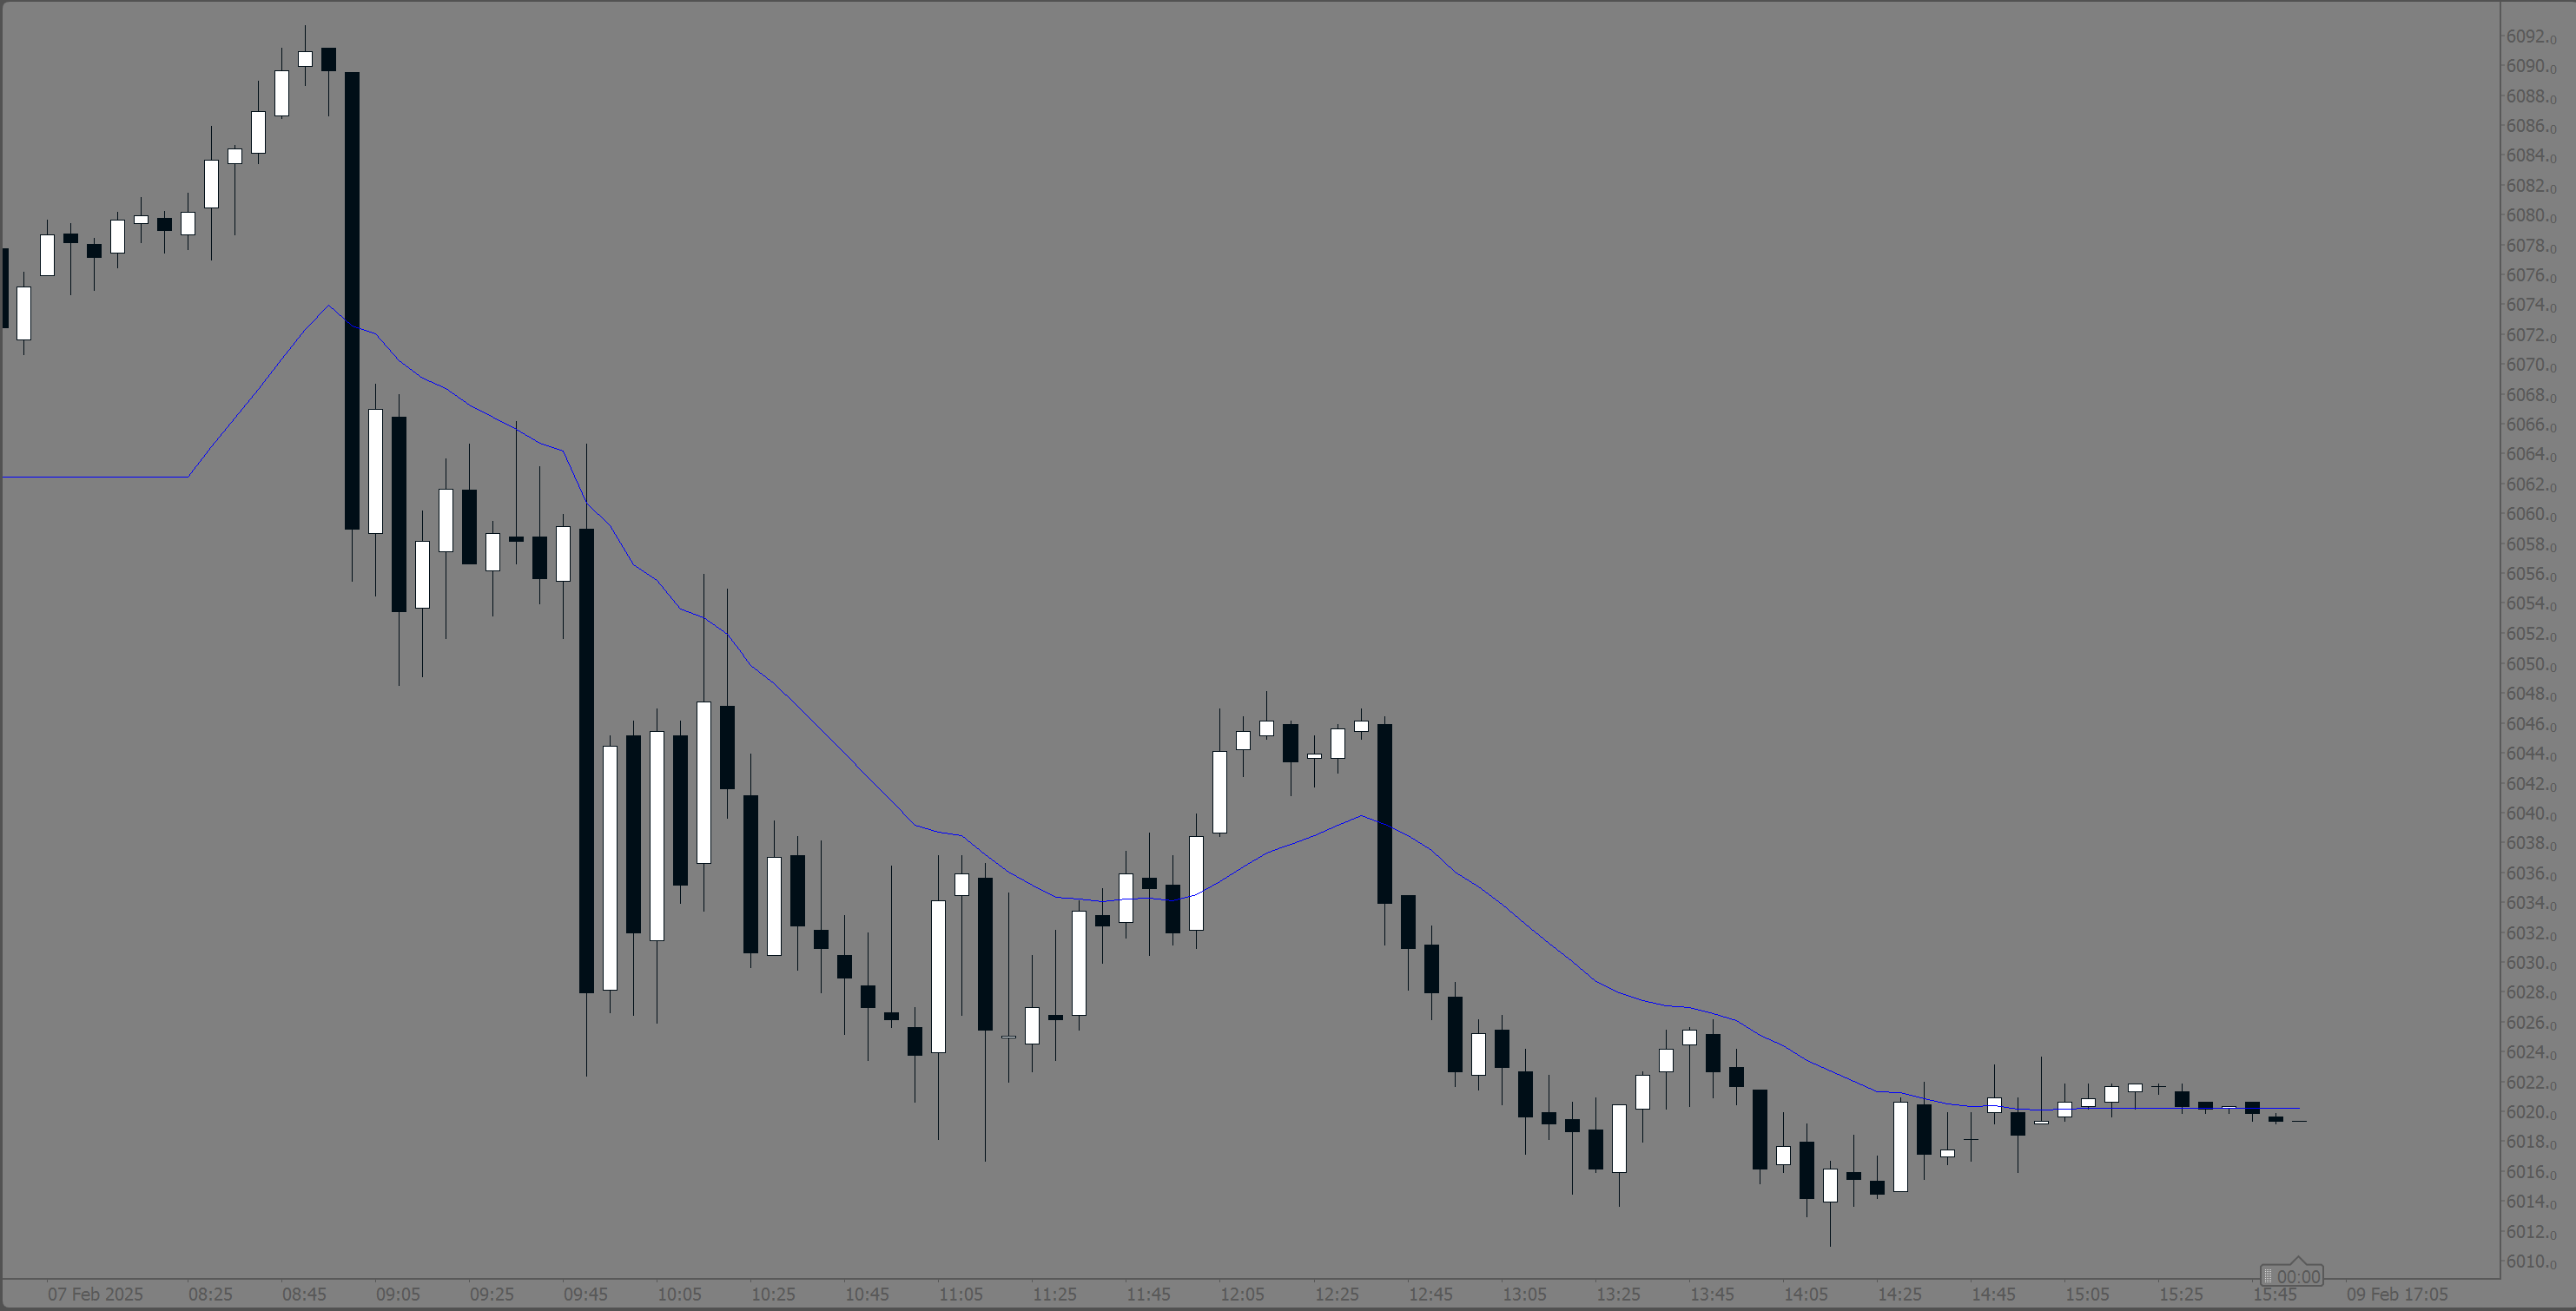
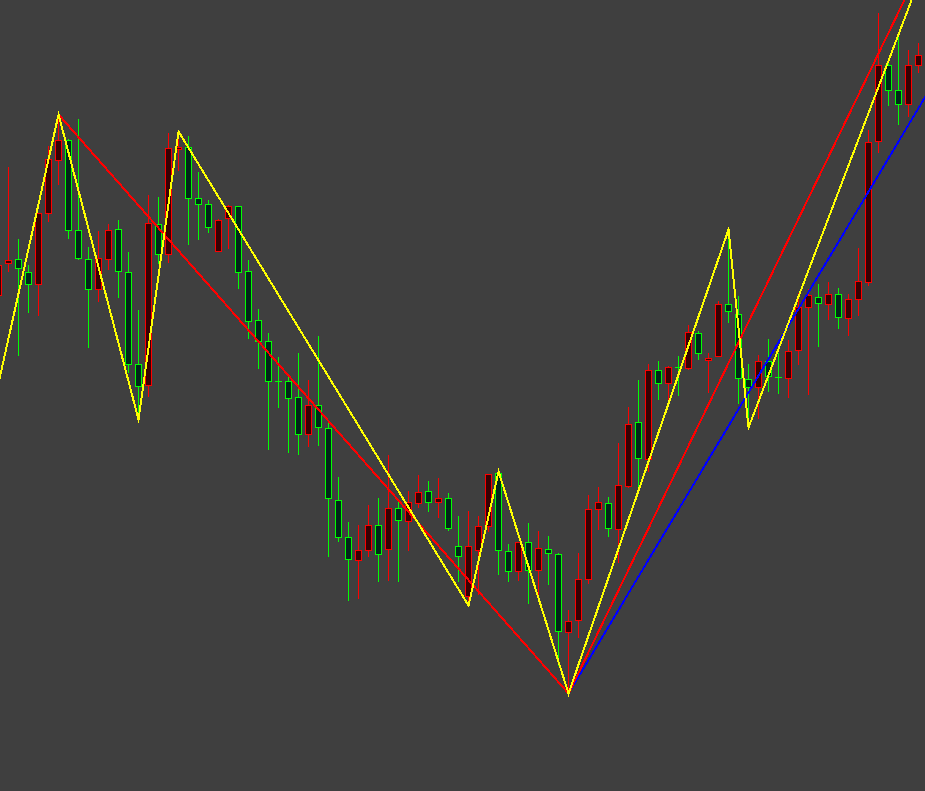
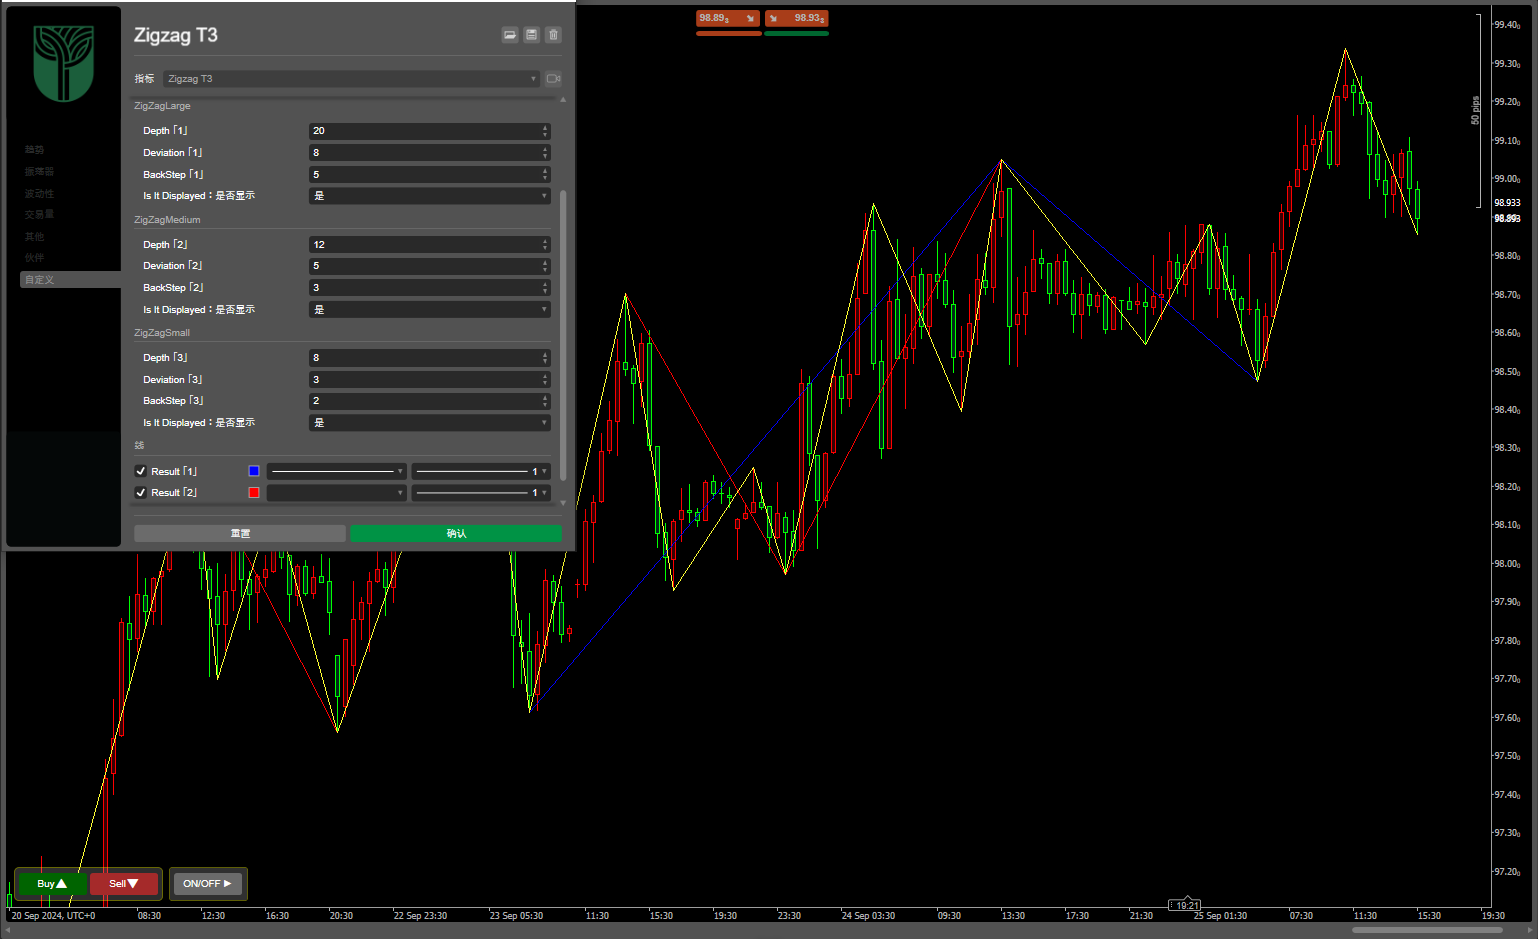
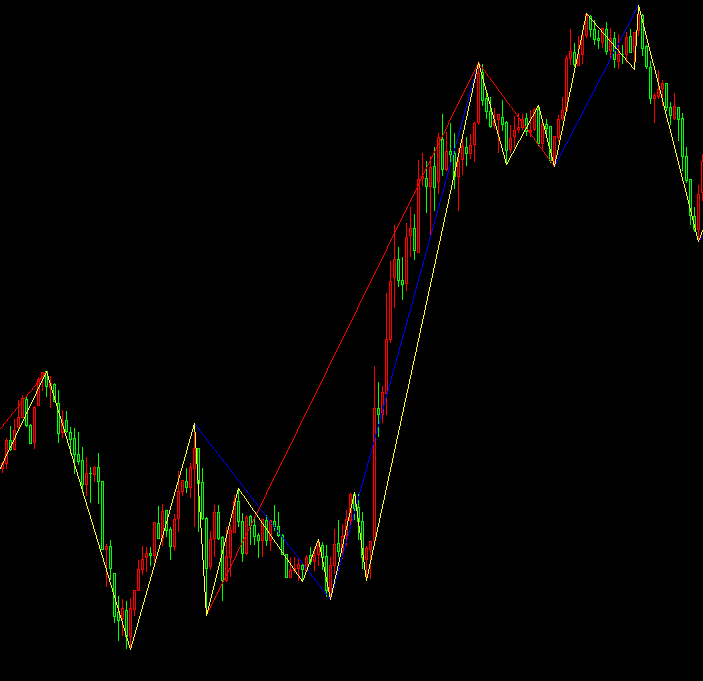
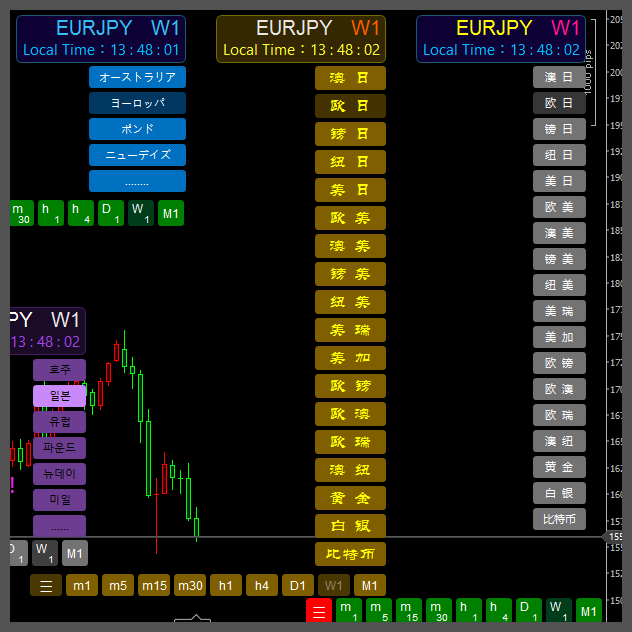
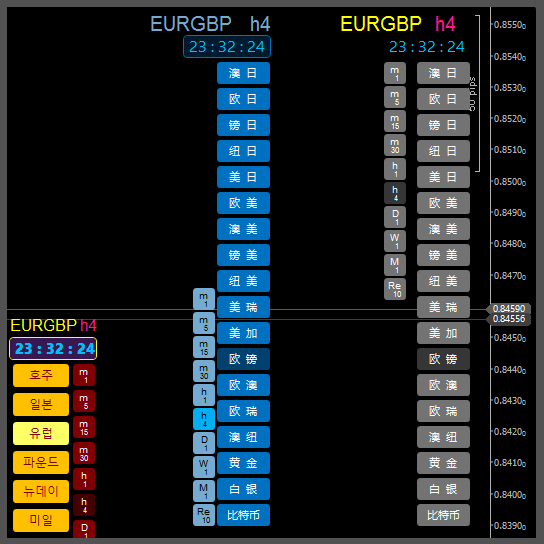
Zigzag T3
Share
03/09/2025
2
Desktop
g.swc
Since 11/09/2024
Sales
3
Free installs
41
Description
Customer reviews
Three ZigZag lines
Can close or open any one or more
Expand
More from this author
ZigZag T3
g.swc
Free
Indicator
VWAP
ZigZag
RSI
+5
ZigZag T3
Three ZigZag lines
Free
Popular
zh-cn Variety Period clock panel(multilanguage)
g.swc
$ 10
Indicator
zh-cn Variety Period clock panel(multilanguage)
This indicator can be used to: change color, shape size, position, change font, increase or decrease, and other function
$ 10
Popular
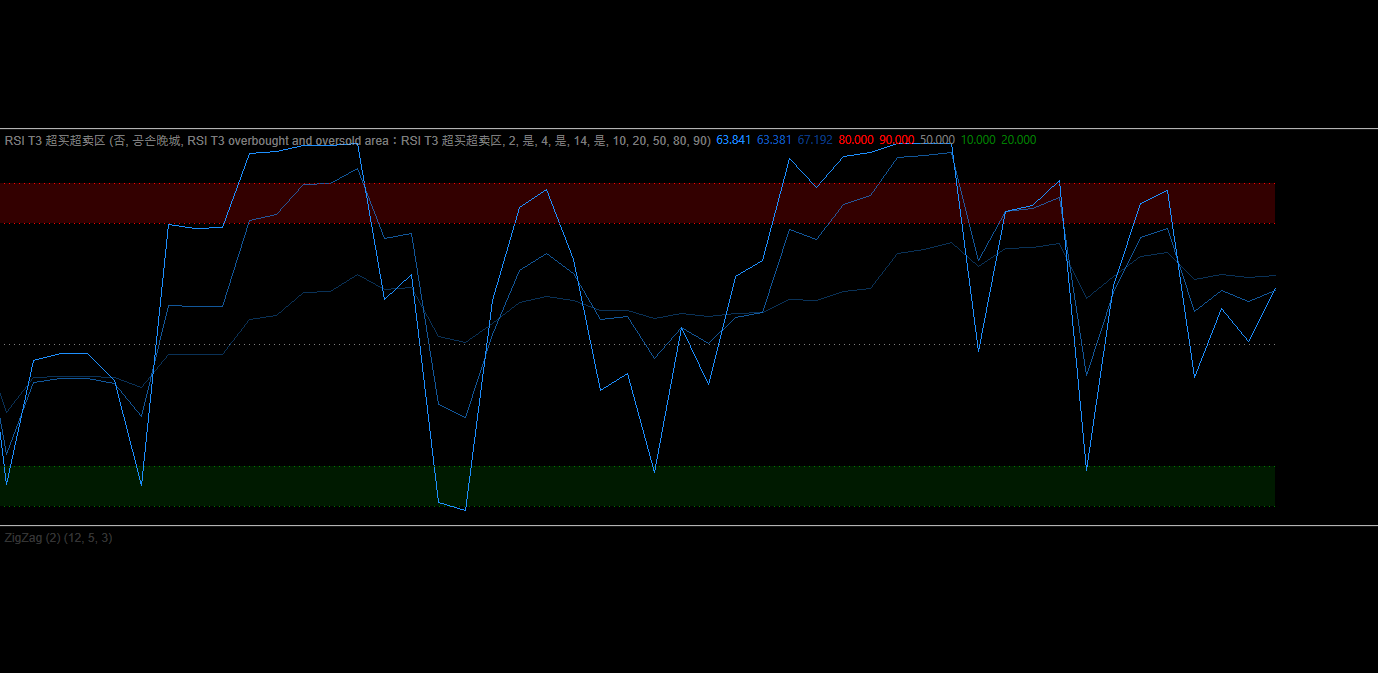
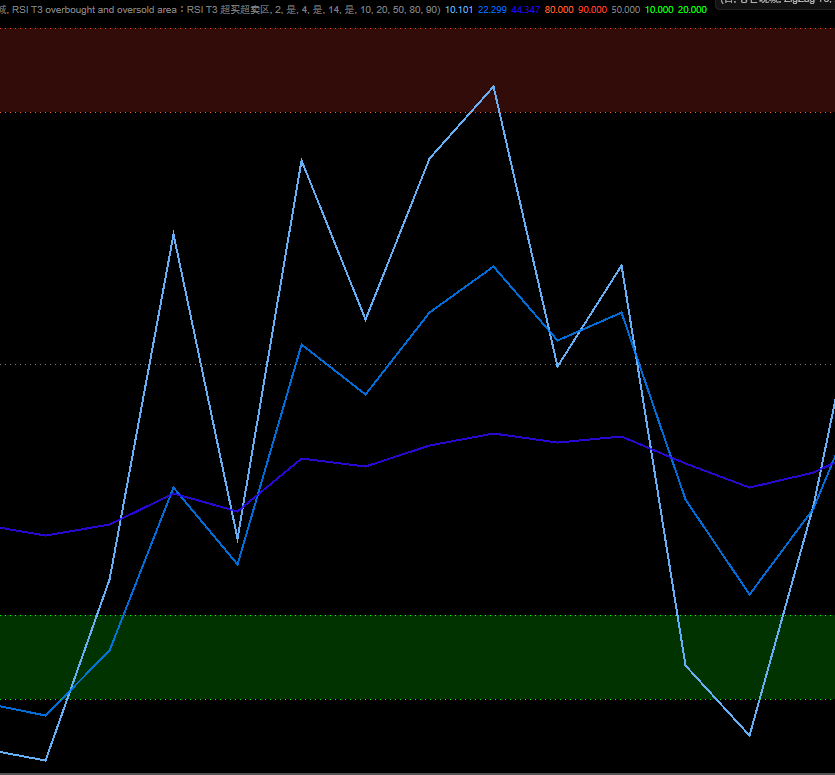
RSI T3 overbought and oversold area
g.swc
$ 10
Indicator
RSI
RSI T3 overbought and oversold area
RSI T3 overbought and oversold area
$ 10
zh-cn Variety Period time panel(multilanguage)
g.swc
$ 10
Indicator
zh-cn Variety Period time panel(multilanguage)
This indicator can be used to: change color, shape size, position, change font, increase or decrease, and other function
$ 10
RSI T3 Overbought and oversold areas
g.swc
$ 10
Indicator
RSI
RSI T3 Overbought and oversold areas
Three parameter RSI
$ 10
Ten Thousand Functions Bands Cloud(First Edition)
g.swc
$ 10
Indicator
ZigZag
RSI
FVG
+4
Ten Thousand Functions Bands Cloud(First Edition)
A metric that can set 1 to 3 groups of Bollinger Bands
$ 10
You may also like
Popular
Zigzag Trend
BossFXTrader
$ 25
/
$45
Indicator
NAS100
NZDUSD
Martingale
+22
Zigzag Trend
The ZigZag Trend is a market structure tool that filters out small price fluctuations and highlights major swing.
$ 25
/
$45
New
ATR on Chart
jayramsay93
Free
Indicator
Indices
XAUUSD
Commodities
+8
ATR on Chart
Plots the ATR on the chart for easy visualization.
Free
Lozano Price Action
Lozano_Price_Action
$ 20
Indicator
RSI
Breakout
Lozano Price Action
LPA simplifies trading by coloring candles with volume data and RSI levels for trend and reversal insights.
$ 20
ZScore Reversion
pinescriptlabs
5.0
(1)
Free
Indicator
RSI
Breakout
XAUUSD
+4
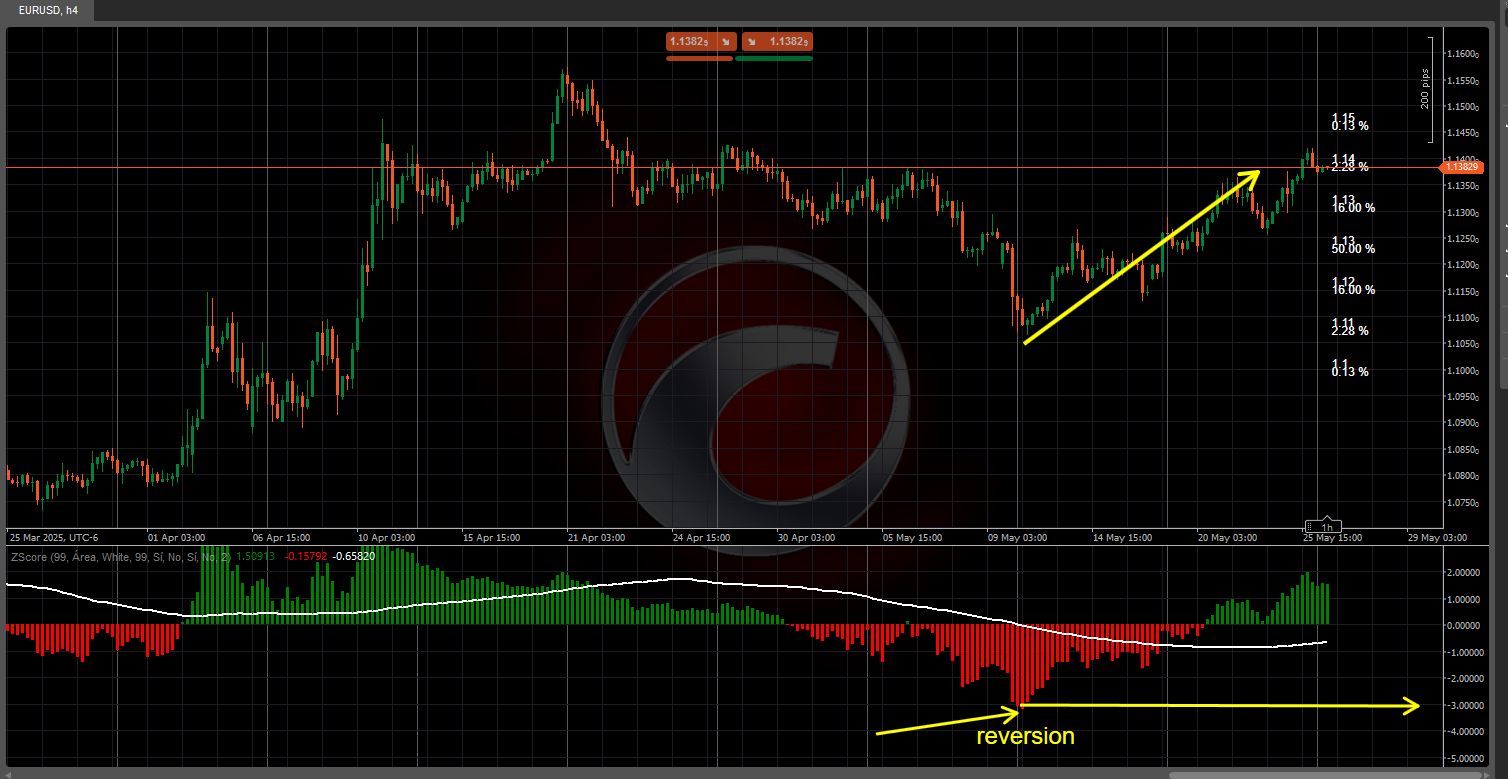
ZScore Reversion
Z-Score: Measures price deviations from its mean. Spots overbought/sold (±2-3 SD) & reversals. Key for stats trading
Free
[Stellar Strategies] Moving Averages Combined 1.0
StellarStrategies
5.0
(1)
Free
Indicator
RSI
Signal
MACD
[Stellar Strategies] Moving Averages Combined 1.0
Smooths price action with 6 MAs (3 SMA, 3 EMA). Reduces noise, clarifies trends 📈📉
Free
[Stellar Strategies] Market Regime Filter
StellarStrategies
Free
Indicator
Indices
ATR
Forex
+1
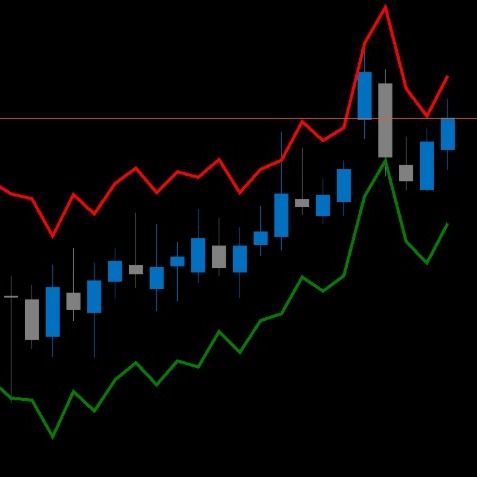
[Stellar Strategies] Market Regime Filter
Filters market regimes (trend/range/pullback) using MAs, ADX, ATR/BBW Vol, opt. Volume. Helps adapt strategy. 📉📈
Free
Popular
AutoLines™ Support & Resistance
o.elmottaqy
$ 10
/
$20
Indicator
Breakout
AutoLines™ Support & Resistance
FlexSR auto‑detects pivot highs/lows to plot dynamic support & resistance lines Features customizable styling and option
$ 10
/
$20
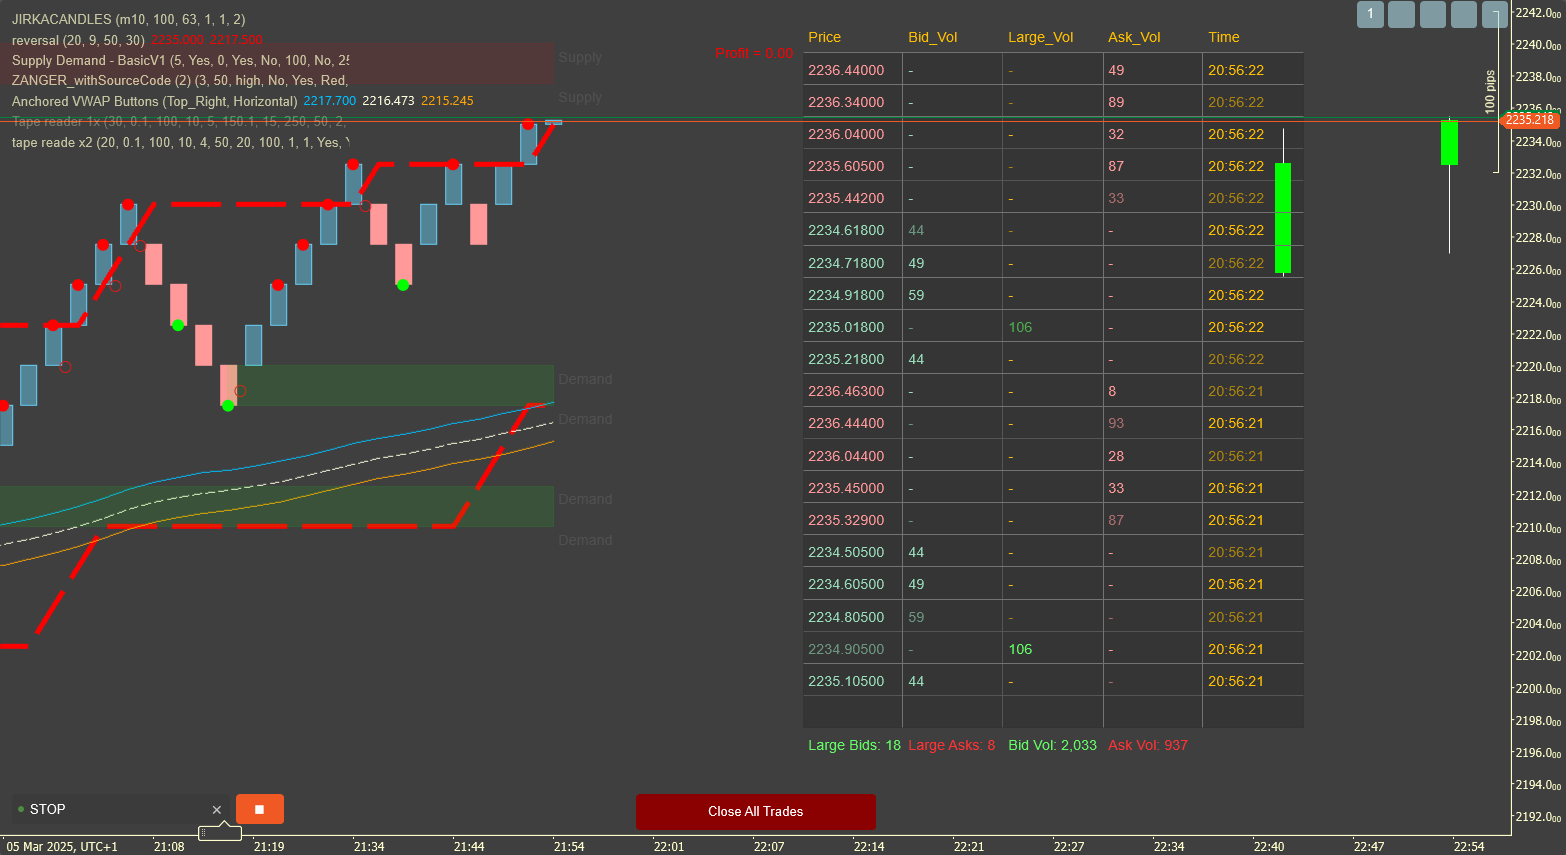
Tape reader
BubakBubu
5.0
(1)
Free
Indicator
Tape reader
TAPE READER :-)
Free
New
Institutional Volume Supply Demand
BubakBubu
Free
Indicator
Grid
NAS100
NZDUSD
+17
Institutional Volume Supply Demand
Volume Profile Supply Demand
Free
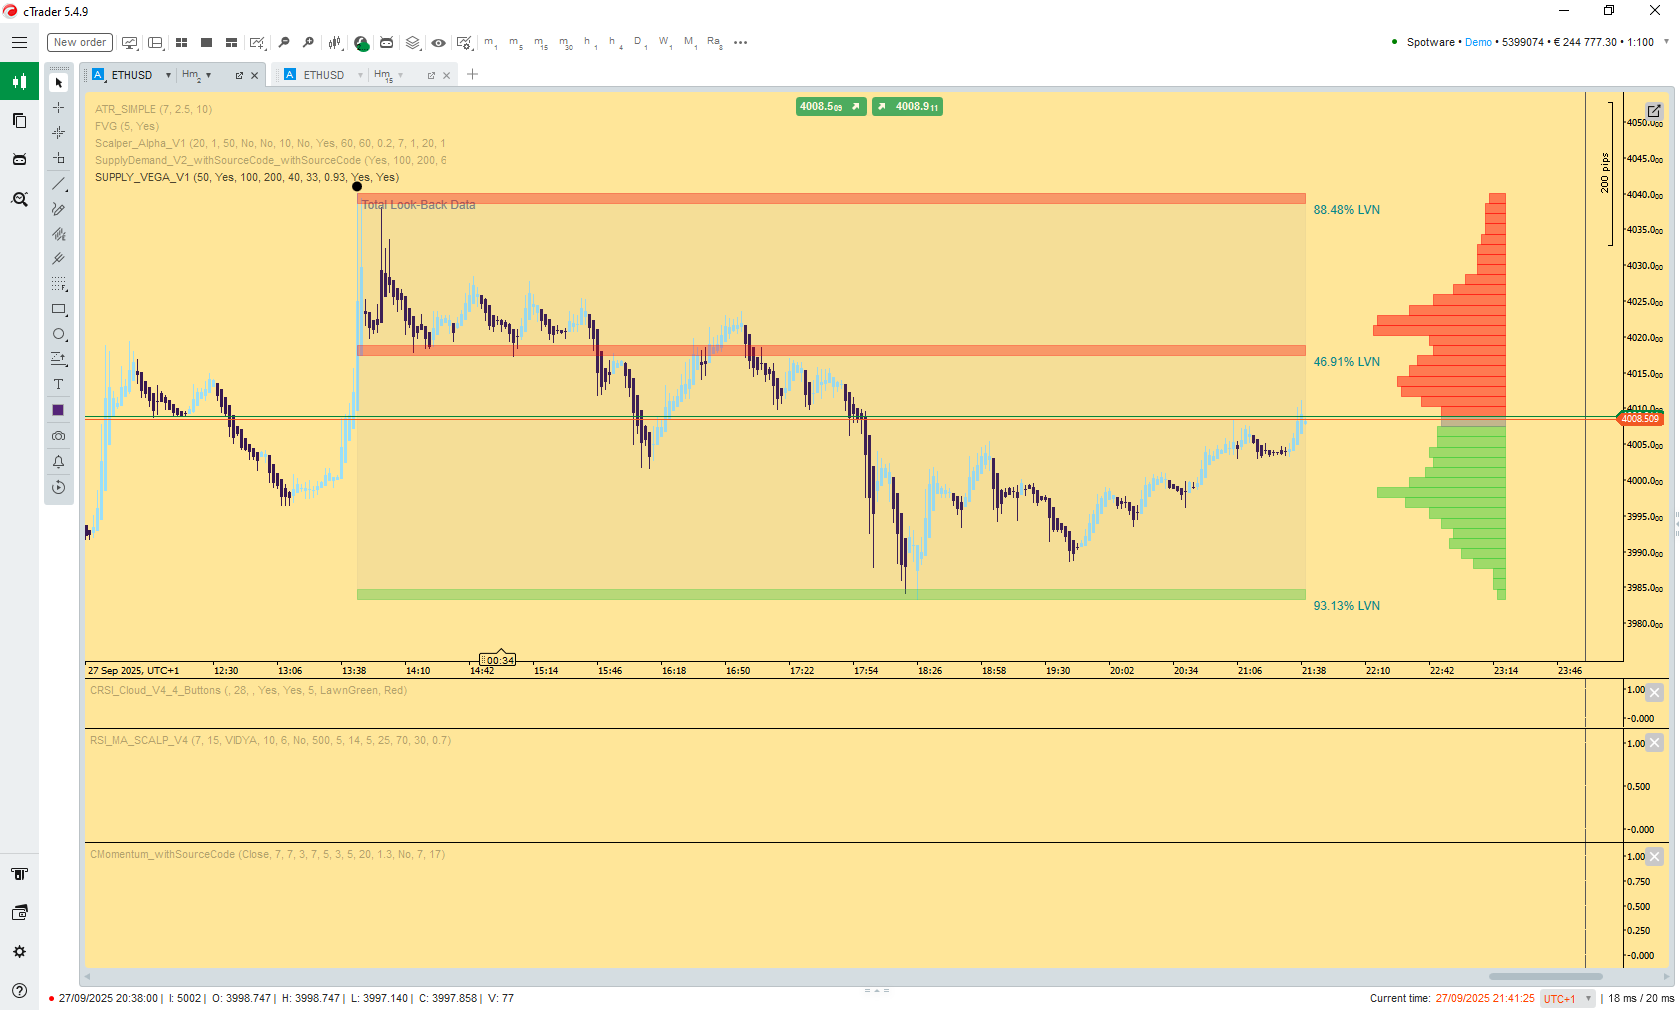
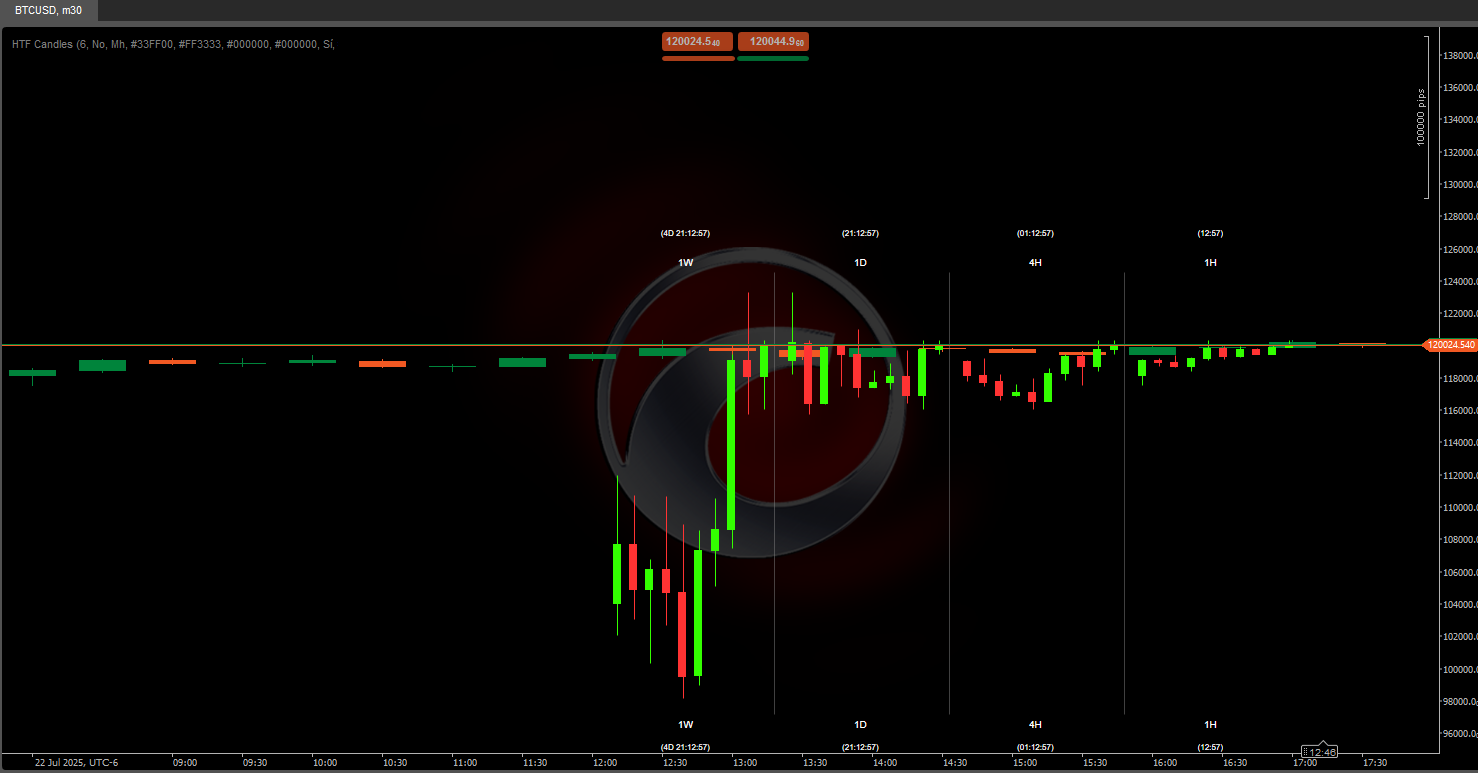
HTF Candles
pinescriptlabs
Free
Indicator
HTF Candles
🌟 HTF indicator for cTrader! Real-time higher timeframe candles (1W-1H) on your chart.
Free
Popular
Trinity StochX
kronosconsultoriaassessoria
$ 10
/
$20
Indicator
RSI
Trinity StochX
Indicator Stochastic With RSI
$ 10
/
$20
New
PivotLevels
trader.bee
$ 25
/
$30
Indicator
Indices
Prop
Commodities
+3
PivotLevels
It draws Pivot Levels on the chart.
$ 25
/
$30
Popular
SmartBot-MACD & RSI Indicator
nvcong89
$ 10
/
$20
Indicator
RSI
MACD
SmartBot-MACD & RSI Indicator
This indicator is a combination of MACD and RSI into one. This is perfect fusion and powerful indicator ever.
$ 10
/
$20
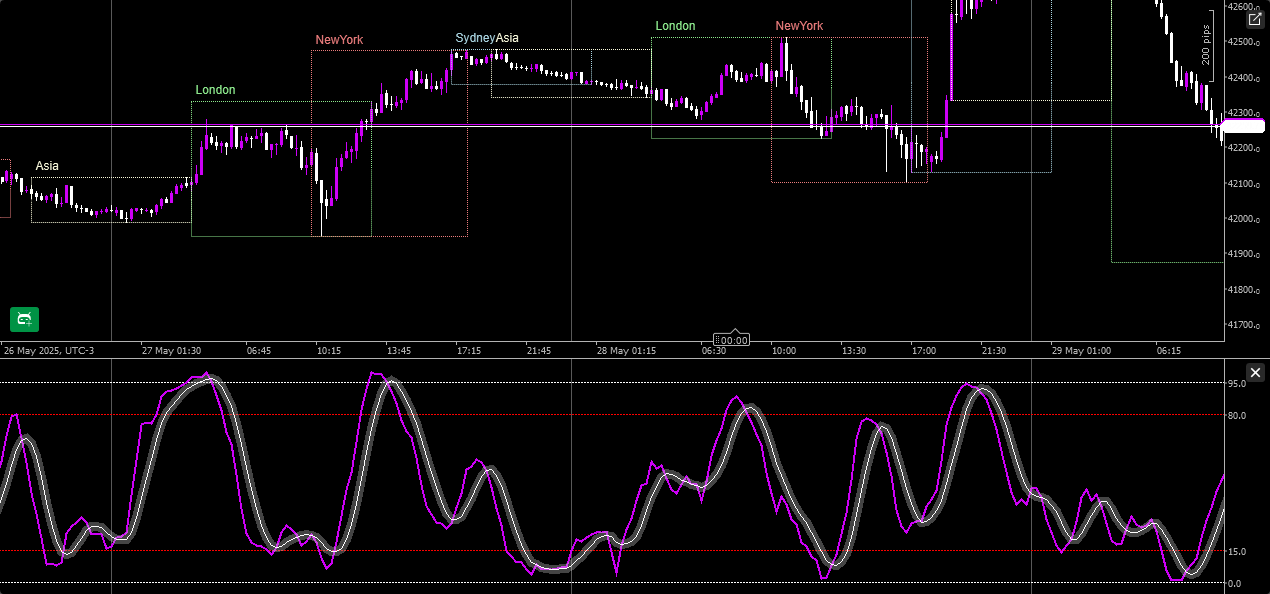
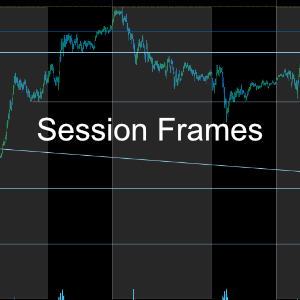
Session Highlight Framer
andrenalin282
Free
Indicator
Session Highlight Framer
Frame the sessions
Free
Popular
[Hamster-Coder] Bollinger Bands
Hamster-Coder
$ 10
/
$20
Indicator
Breakout
Signal
Bollinger
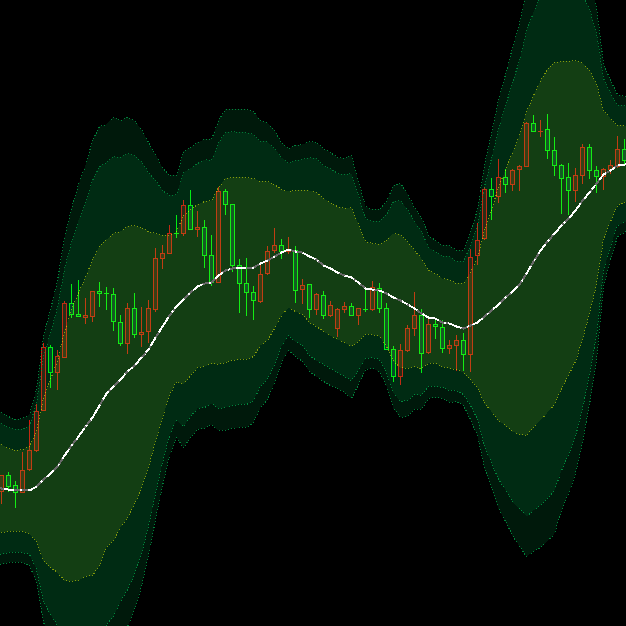
[Hamster-Coder] Bollinger Bands
Bolliger Bands + Hamster-Coder™ Timeframe Decoupling
$ 10
/
$20
Popular
Order Block detector PRO
LudwigICT
$ 10
Indicator
Order Block detector PRO
Order Block PRO — Smart Institutional Zone Detector
$ 10
Ema
yohtza
Free
Indicator
NAS100
EURUSD
GBPUSD
Ema
An exponential moving average based on regular trading hours.
Free
Pips V4Final
Bilite
$ 10
Indicator
Pips V4Final
Displays pips from daily open with high/low. Clean, customizable, perfect for quick daily price context.
$ 10
Load more


!["[Stellar Strategies] Moving Averages Combined 1.0" logo](https://market-prod-23f4d22-e289.s3.amazonaws.com/b4cd360c-5f3c-4902-b2e1-6b86da1199bb_Gemini_Generated_Image_nl1erpnl1erpnl1e.jpg)
!["[Stellar Strategies] Market Regime Filter" logo](https://market-prod-23f4d22-e289.s3.amazonaws.com/cb84a98c-46f6-4cfd-b0ba-16518a618cb1_cT_cs_4141285_EURUSD_2025-04-20_16-50-30.png)


!["[Hamster-Coder] Bollinger Bands" logo](https://market-prod-23f4d22-e289.s3.amazonaws.com/1114cb2b-7120-42b3-8f53-dbc26968e6af_Icon300.jpg)