
Institutional Volume Supply Demand
Indicator
1.51K downloads
Version 1.0, Sep 2025
Windows, Mac
4.4
Reviews: 5
Description
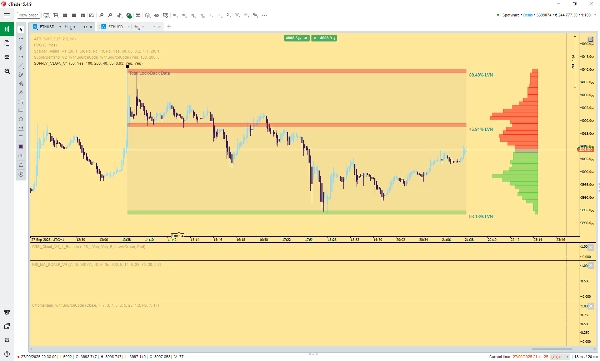
Volume Profile Zones (Supply/Demand)
The Volume Profile Zones indicator provides an institutional-grade view of market structure by leveraging Volume at Price analysis. It automatically identifies high-probability Support and Resistance levels based on market inefficiencies and liquidity voids.
Key Features:
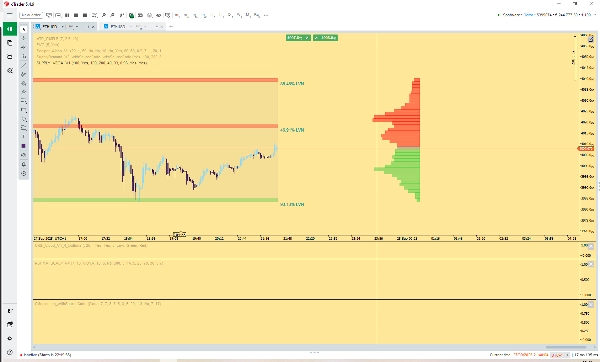
- Institutional S&R (LVNs): Automatically calculates and marks Low Volume Nodes (LVNs)—areas where the price moved quickly with minimal trading volume. These LVNs act as high-conviction future Supply (Resistance) and Demand (Support) zones.
- Dynamic Look-Back: The profile automatically adjusts its analysis period to focus only on the current major swing or trend, resetting after a significant market pivot.
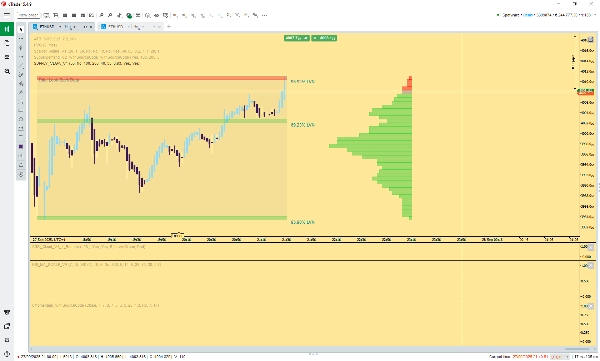
- Price-Relative Coloring: The visible Volume Profile histogram and the corresponding Supply/Demand zones are dynamically colored based on the current price:
- Green: Volume areas below the current price (acting as Demand/Support).
- Red: Volume areas above the current price (acting as Supply/Resistance).
- LVN Strength: Zones are labeled with a percentage indicating the weakness of the volume at that level, providing an objective measure of the zone's theoretical strength (liquidity void size).
This tool is essential for traders who utilize advanced market structure, order flow, or Volume Profile techniques to identify key points of interest and anticipate market turns.
Summary
AI summary
The Institutional Volume Supply Demand indicator offers an advanced market structure analysis using Volume Profile Zones based on Volume at Price data. It automatically identifies key Support and Resistance levels by detecting Low Volume Nodes (LVNs), which represent areas where price moved rapidly with minimal trading volume, indicating potential future supply (resistance) and demand (support) zones. The indicator dynamically adjusts its look-back period to focus on the current major swing or trend, resetting after significant market pivots. It visually distinguishes supply and demand zones with color coding: green for volume areas below the current price (demand/support) and red for areas above (supply/resistance). Each LVN is labeled with a percentage that quantifies the weakness of volume at that level, providing an objective measure of zone strength based on liquidity void size. This tool supports traders employing advanced techniques such as order flow and Volume Profile analysis to identify high-probability market turning points. It is applicable across various markets including Forex pairs (e.g., EURUSD, GBPUSD, NZDUSD, USDJPY), cryptocurrencies (BTCUSD), indices (NAS100), and commodities (XAUUSD).
Indicator profile
Customer reviews
4.4
Reviews: 5
5 | 80 % | |
4 | 0 % | |
3 | 0 % | |
2 | 20 % | |
1 | 0 % |
Customer reviews
May 15, 2026
CTrader's recent update has made this indicator obsolete. It simply stops CTrader from working. this Indicator needs an update to correlate with the Ctrader update.
April 8, 2026
November 3, 2025
Excelente indicador para quem opera baseado em zonas de liquidez, oferta e demanda institucional. Ótimo trabalho!
Discussion
FAQ
BTCUSD
Forex
Signal
Breakout
EURUSD
GBPUSD
NZDUSD
Bollinger
Fibonacci
ZigZag
Scalping
Fair Value Gap
SMC
Grid
AI
XAUUSD
NAS100
MACD
USDJPY
VWAP
Products available through cTrader Store, including trading bots, indicators and plugins, are provided by third-party developers and made available for informational and technical access purposes only. cTrader Store is not a broker and does not provide investment advice, personal recommendations or any guarantee of future performance.


Price
Since 09/01/2025
11.78K
Free installs