HTF Candles
"HTF Candles" logo
25/07/2025
50
Desktop
Since 03/10/2024
Sales
101
Free installs
14856

Pinescriptlabs Store indicators:                        Pinescriptlabs  Store cBots :  (cBot) Gold & BTC BreakoutSession Pivots(new)


Advanced Market Structure: Bos, Choch, SwinLevels, Order Blocks,  Market Structure & Liquidity Finder (New)

ZigZag Price Liquidity Projection

Trailing Smart Algorithm (new)

S&R Structural ZigZag                                

ZigZag

 BOS & CHOCH

Zones Supply Demand

Leverage Liquidation Map

Auto-Trend Channel


Volume POC Heatmap


PREMIUM SSL CHANNEL

Prediction Based on Linreg & ATR

 ICT Power of 3 
                                                   

SmartTrend Support &
Resistance
Lines
       

Fair Value Gap Sessions                


RSI Trend Trigger

Channel Breakout System

Supertrend

Market Imbalance

Adaptive Trend Channel 

Dynamic
Market Structure
Analysis
of
Turning
Points

Order Block

Fibonacci
Linear
Regression
Multi-timeframe

Dynamic RSI

Momentum Fair Value Gap

Market Flow Projection

Dynamic Trend Gradient

Multi-Level
Candle Bias
Tracker

Zig-Zag Extremity Tracker

Reactive Moving Average

Auto
Support and
Resistance
Trend
Lines

All
Support and
Resistance
Levels

Dynamic Range Momentum


🌟 Great effort from the team to develop this Ctrader indicator! Support us by sharing - visual improvements including horizontal scroll coming soon!
⚠️ Technical Note: Manual zoom/scroll currently required for optimal viewing ("Temporary limitation: Works best on timeframes below 1H due to Ctrader platform visual constraints")

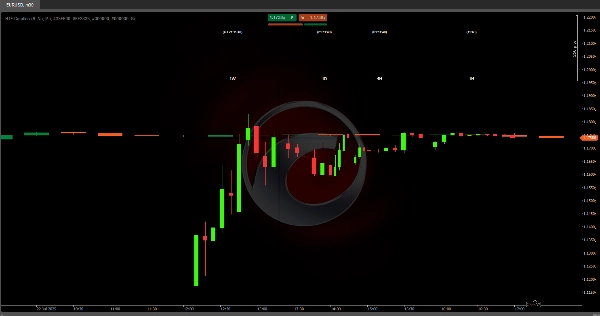
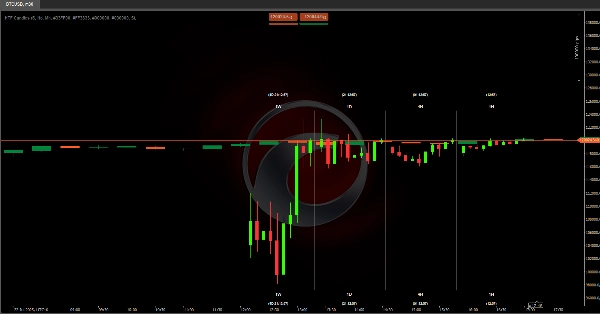
📊 Real-Time HTF Visualization
This algorithm displays higher timeframe candles (1W, 1D, 4H, 1H) directly on your trading chart, giving you complete market structure at a glance - no window switching needed!

🔍 Quick Analysis
Spot major trends (daily/weekly direction) while trading lower timeframes
• Advanced Feature: HTF candles update in real-time - color changes instantly show momentum shifts

⚙️ How To Use
• Toggle individual HTF blocks on/off
• Adjust visible candles (1-10 per timeframe)

💡 Game-Changing Benefits
Now you can:
1️⃣ Anticipate key candle closings
2️⃣ Detect trend reversals live
3️⃣ Monitor key levels across multiple timeframes simultaneously

🚀 Coming Improvements
Horizontal scroll will enable:
• Historical HTF pattern analysis
• Current vs. past structure comparison
• Key zone identification on higher timeframes

📚 Practical Examples
• When 1W = green & 1D = red → Market is correcting within bullish trend → Only short at key resistance bounces
• Trend Hierarchy: 1W > 1D > 4H > 1H → Always trade with weekly candle direction
• Confluence Entries:

  • Price at 1D support + emerging green 4H candle = Long opportunity
  • Resistance at 1H high + red 4H candle = Short with stop above high
    • Breakout Patterns:
  • If 1H candle breaks previous high before closing (timer active), expect bullish continuation


More from this author
Indicator
RSI
Breakout
XAUUSD
+6
ZigZag
ZigZag filters noise, spots trends, patterns, pivots, aiding analysis, trade management, and confirmations. 📉📈
Indicator
RSI
Breakout
XAUUSD
+6
Order Block
Identify bullish and bearish Order Blocks to spot key support/resistance levels and potential trend reversals! 📈🔄
Indicator
RSI
Breakout
XAUUSD
+5
Auto-Trend Channel
Adaptive trend channel using linear regression and Pearson correlation for dynamic support, resistance, and trends.
Indicator
RSI
XAUUSD
Breakout
+5
BOS & CHOCH
Market structural patterns , specifically the concepts of Change of Character (ChoCH) 🔄 and Break of Structure (BoS) 💥
Indicator
RSI
Breakout
XAUUSD
+5
Zones Supply Demand
📊Zones Supply & Demand: Identifies key price levels with high volume concentration, marking Supply/Demand Zones & Marke
Indicator
RSI
Breakout
XAUUSD
+5
Supertrend
💹 Define a price channel 📈 and determine trend direction (bullish 🟢 or bearish 🔴).
Indicator
RSI
Breakout
XAUUSD
+6
Volume POC Heatmap
📊 Shows volume by price levels, highlights POC, and key zones. Identifies dynamic support/resistance and imbalances.
Indicator
RSI
Breakout
Supertrend
All Support and Resistance Levels
"Identify key market zones and visualize support/resistance from multiple timeframes on a single chart.
Indicator
RSI
Breakout
XAUUSD
+6
Fair Value Gap Sessions
identify and highlight temporary market inefficiencies known as "fair value gaps" 🚨 within specific trading Sessions.
Indicator
RSI
Breakout
XAUUSD
+4
Dynamic Market Structure Analysis of Turning Points
Identify market structure effortlessly with swing highs, lows, CHoCH, and BOS levels for smart trading decisions! 📊🔍"
Indicator
Indices
RSI
XAUUSD
+7
RSI Divergence
Detects bullish and bearish divergences
Indicator
RSI
Breakout
Supertrend
Trend Heikin Multi MA
🚀 TrendHeikinMultiMA: Advanced trend detection using Heikin-Ashi smoothing & MAs! Eliminates noise, confirms real trend
Indicator
RSI
Breakout
XAUUSD
+4
Multi-Level Candle Bias Tracker
Price direction by calculating the probability of reaching new highs/lows. Shows levels & stats📈
Indicator
RSI
Breakout
Supertrend
Leverage Liquidation Map
📊 Liquidation Map: Potential areas where highly leveraged investors might face liquidations.
Indicator
RSI
Breakout
Supertrend
Market Trend OB
Price action to detect when the market changes trend (MSB) and defines, order blocks , ZigZag etc.📊
Advanced Market Structure Bos,Choch,SwinLevels, Order Blog
Advanced price action tool that combines multiple technical analysis concepts
Indicator
RSI
Breakout
Supertrend
+3
Fibonacci Linear Regression Multi-timeframe
Combining Fibonacci levels and regression to analyze multidimensional market trends across multiple timeframes¡
Indicator
RSI
Breakout
Supertrend
Zig-Zag Extremity Tracker
Dynamically adjusts regression channels based on ZigZag extremes, resetting when price breaks bands to track real trends
You may also like
Weekly Daily Levels
The Weekly Daily Levels indicator shows the OHLC, and mid-point prices for the previous day and week.
Moving Average channel
This indicator is designed to display customizable moving averages (MAs) on a chart.
Indicator
Breakout
Stocks
Signal
Darvas Box
The Darvas Box involves identifying "boxes" or trading ranges where a stock's price consolidates before breaking out.
VegaXLR - Candlestick Patterns Pro
Identify 34 candlestick patterns, track trends across timeframes, and get instant alerts with this powerful trading tool
Pivot Point Super Trend
Laser entries with pivot confirmation. No repaint, all timeframes. Professional results.
True Trend H4
It draws a step line that visualize the movement of H4. Particularly effective when trade on lower timeframe.
VWAP
Track VWAP for Asia, London, NY, Sydney, Daily, Weekly, Monthly & Custom Sessions. Perfect for FX & intraday trading!
Chaikin Money Flow
Chaikin money flow's primary purpose is to distinguish between periods of accumulation and distribution of a security.
Indicator
XAUUSD
ATR
Commodities
+1
[Stellar Strategies] Visual Trend Momentum
Visual Trend Momentum is a MA/ATR/Volume trend tool. Visual signals for strong trends & reversals. Customizable. 📈📉
Indicator
RSI
Stocks
Forex
+1
Market Cipher A
Market Cipher A
Indicator
NAS100
NZDUSD
XAUUSD
+11
FBX VWAP
FBX VWAP Anchored — Professional VWAP
ADX and ADI
This custom indicator is a complete implementation of the Average Directional Index and Directional Indicators.
Supertrend Indicator v1.1
SUPERTREND INDICATOR v1.1
Bar Explosion
cTrader indicator with mini-timeframe candlesticks. Customize timeframe, colors, margins. Perfect for traders.
Indicator
Signal
Hammer Pattern Indicator
Top-rated
Free
Indicator
ATR
Supertrend
PMAX
It's a combination of two trailing stop loss and the other one is well-known ATR-based SuperTrend.
Indicator
Indices
XAUUSD
Stocks
+5
cAlgoBuddy - Ultimate Candlestick Patterns
The ultimate candlestick suite is here to help you detect most of the candlestick patters that exist today.
Indicator
RSI
XAUUSD
Breakout
+5
BOS & CHOCH
Market structural patterns , specifically the concepts of Change of Character (ChoCH) 🔄 and Break of Structure (BoS) 💥