Dynamic Candle Timer v1.5 2025

5.0
03/09/2025
478
Desktop
Overview:
This is a must-have tool for traders who rely on candle timing. Whether you're a scalper, day trader, or swing trader, this indicator ensures you're always aware of how much time remains—or has passed— on the current bar.
Why Use This Indicator?
- Trade with Precision: Know exactly when the current candle will close.
- Flexible Timer Modes: Track time in multiple ways to match your trading style.
- Audio Notifications: Get alerts when the candle is nearing its end or reaching to a certain point.
- Customizable Placement: Fix the timer anywhere on the chart or attach it to the latest candle.
- Optimized Performance: Lightweight and efficient for smooth execution.
- Multiple Chart Types: Works on Time-Based, Heikin Ashi, and Tick Charts.
Key Features:
✅ Multiple Timer Modes: Choose how to track candle progress:
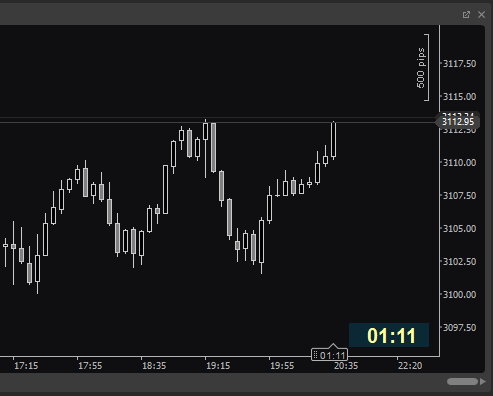
- Time Remaining (HH:MM:SS)
- Time Passed (HH:MM:SS)
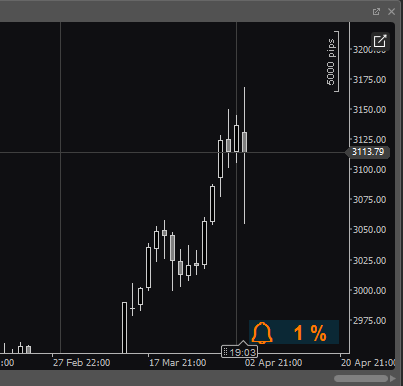
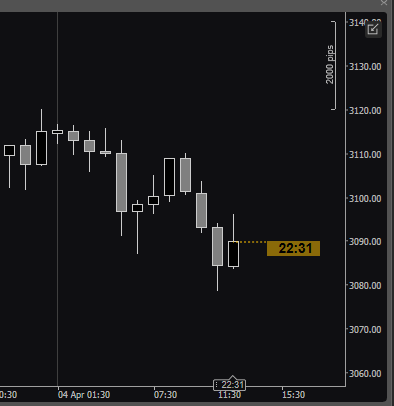
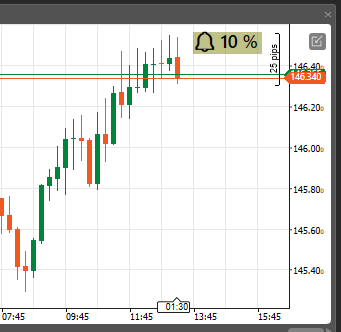
- Percentage Remaining
- Percentage Passed
- Seconds Remaining
- Seconds Passed
✅ Dynamic or Fixed Positioning:
- Fixed Mode: Set the timer at a specific chart location.
- Dynamic Mode: Attach the timer to the latest candle’s closing price.
✅ Notification Alerts:
- Set an audio alert to notify you when a certain amount of time remains before the candle closes.
✅ Customizable Appearance:
- Adjust font size, color, background, and position to match your chart style.
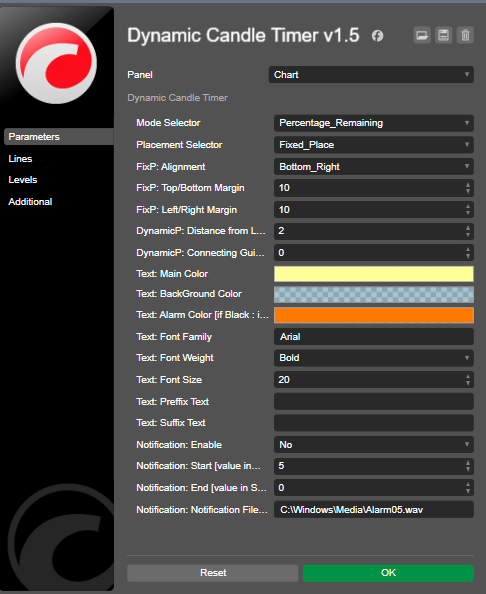
Customizable Settings & Parameters:
🛠 Timer Type: Choose from 6 different tracking modes.
📍 Positioning: Select fixed placement or attach to the latest candle close.
🔊 Alert Settings: Set a custom time-window for sound notifications.
🎨 Appearance Options: Customize font, colors, and background.
Never miss a candle close again —use Dynamic Candle Timer!
More from this author

You may also like
.jpeg)
.jpeg)
!["[Stellar Strategies] Market Structure Breakout" logo](https://market-prod-23f4d22-e289.s3.amazonaws.com/99d762b3-fbbe-489d-9c19-e72c41ffe387_cT_cs_4141285_EURUSD_2025-04-21_20-25-12.png)
!["[Stellar Strategies] Market Regime Filter" logo](https://market-prod-23f4d22-e289.s3.amazonaws.com/cb84a98c-46f6-4cfd-b0ba-16518a618cb1_cT_cs_4141285_EURUSD_2025-04-20_16-50-30.png)


!["[Stellar Strategies] Moving Averages Combined 1.0" logo](https://market-prod-23f4d22-e289.s3.amazonaws.com/b4cd360c-5f3c-4902-b2e1-6b86da1199bb_Gemini_Generated_Image_nl1erpnl1erpnl1e.jpg)