"RT Stochastic RSI PRO" logo
RT Stochastic RSI PRO
0.0
03/09/2025
1
Desktop
"RT Stochastic RSI PRO" uploaded image"RT Stochastic RSI PRO" uploaded image"RT Stochastic RSI PRO" uploaded image"RT Stochastic RSI PRO" uploaded image"RT Stochastic RSI PRO" uploaded image"RT Stochastic RSI PRO" uploaded image"RT Stochastic RSI PRO" uploaded image

Introducing Stochastic RSI PRO for cTrader, an advanced version of the Stochastic RSI indicator designed to enhance your trading precision.

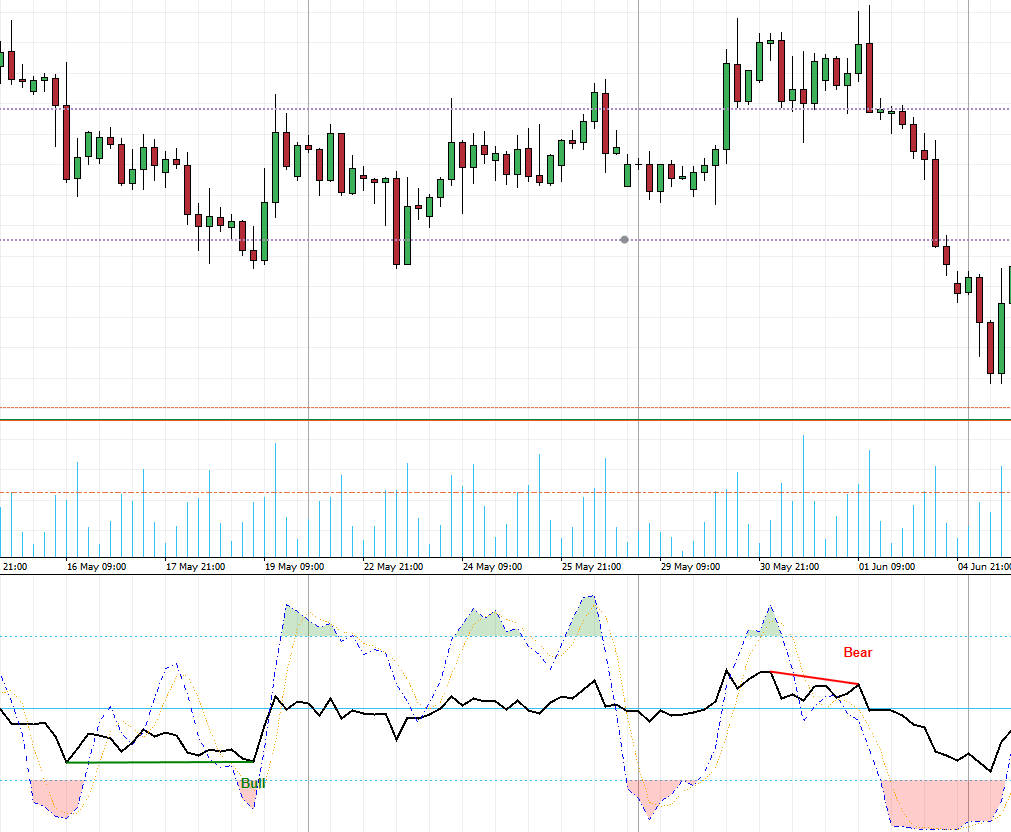
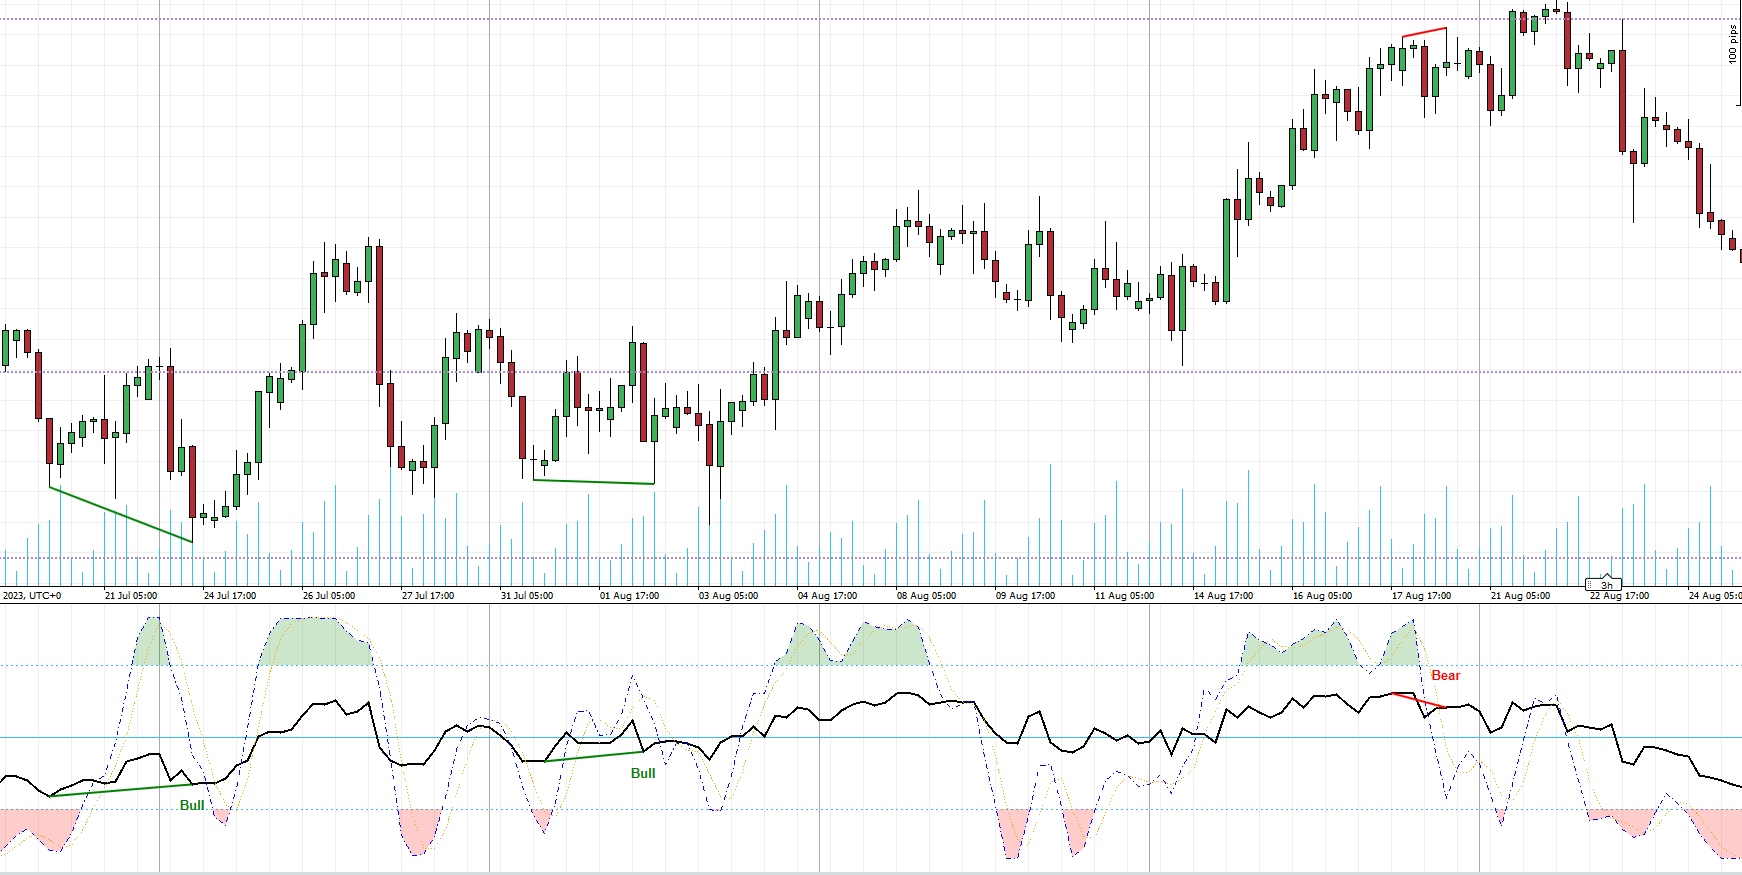
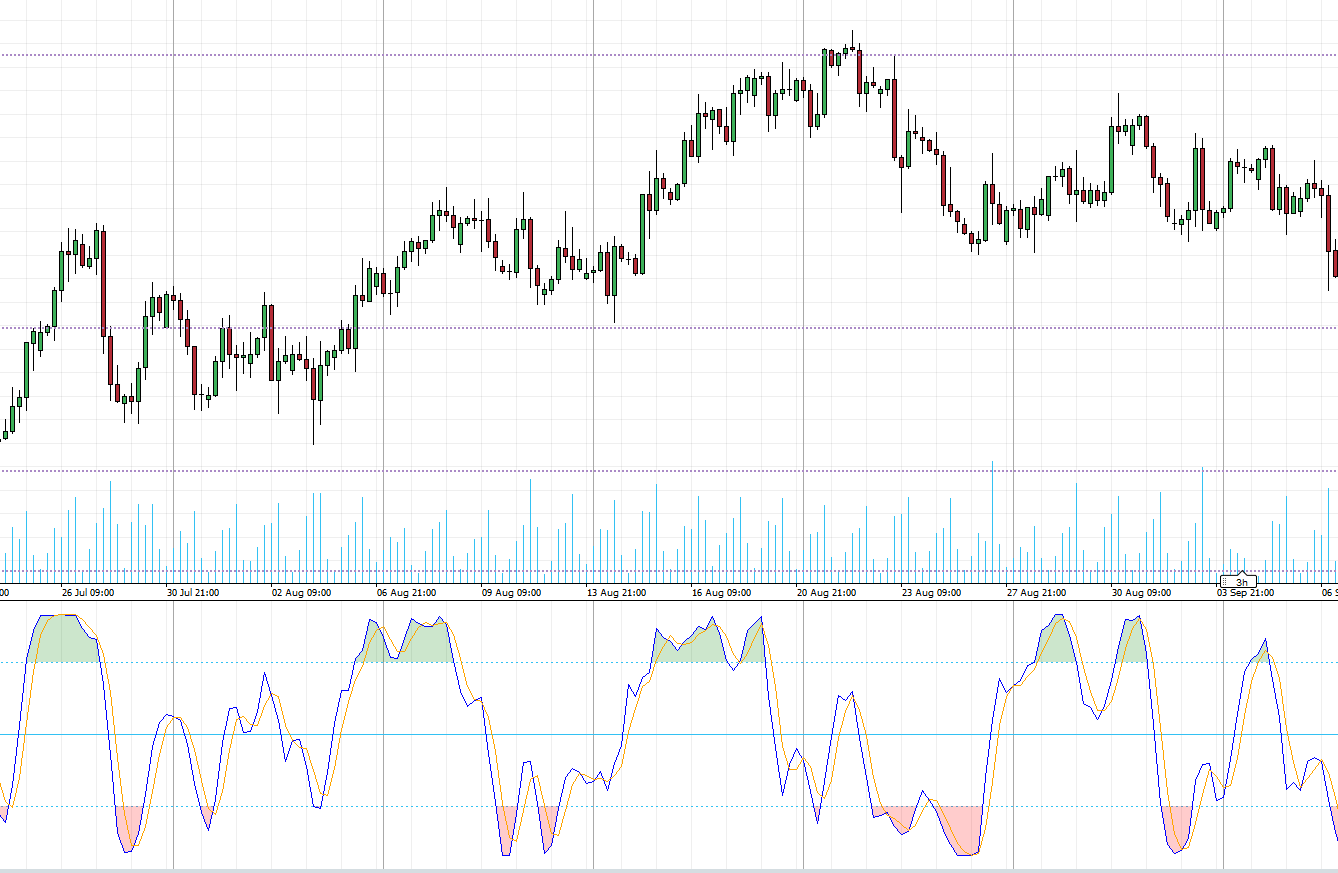
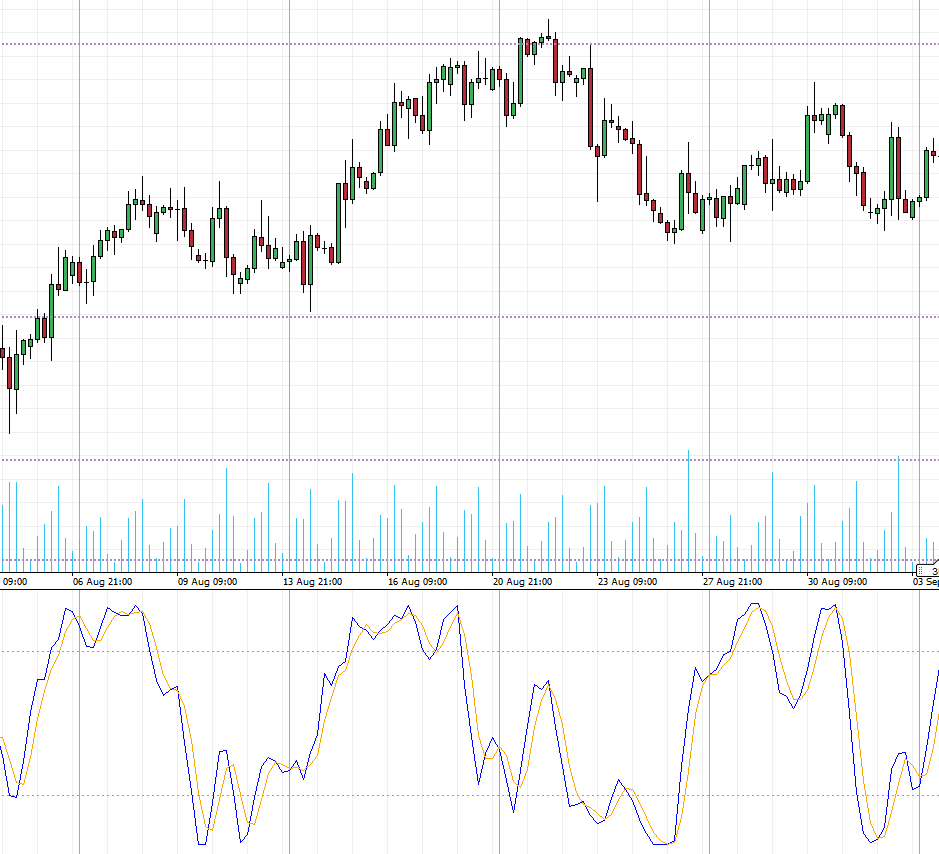
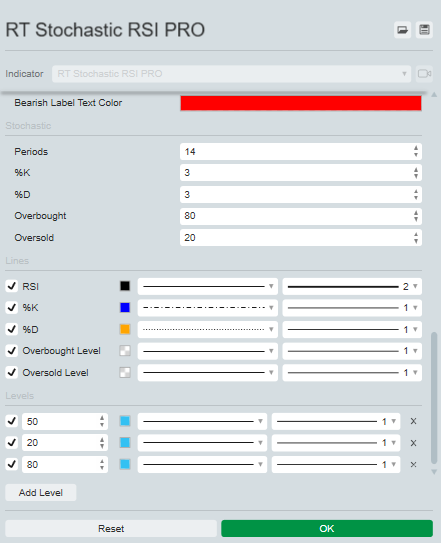
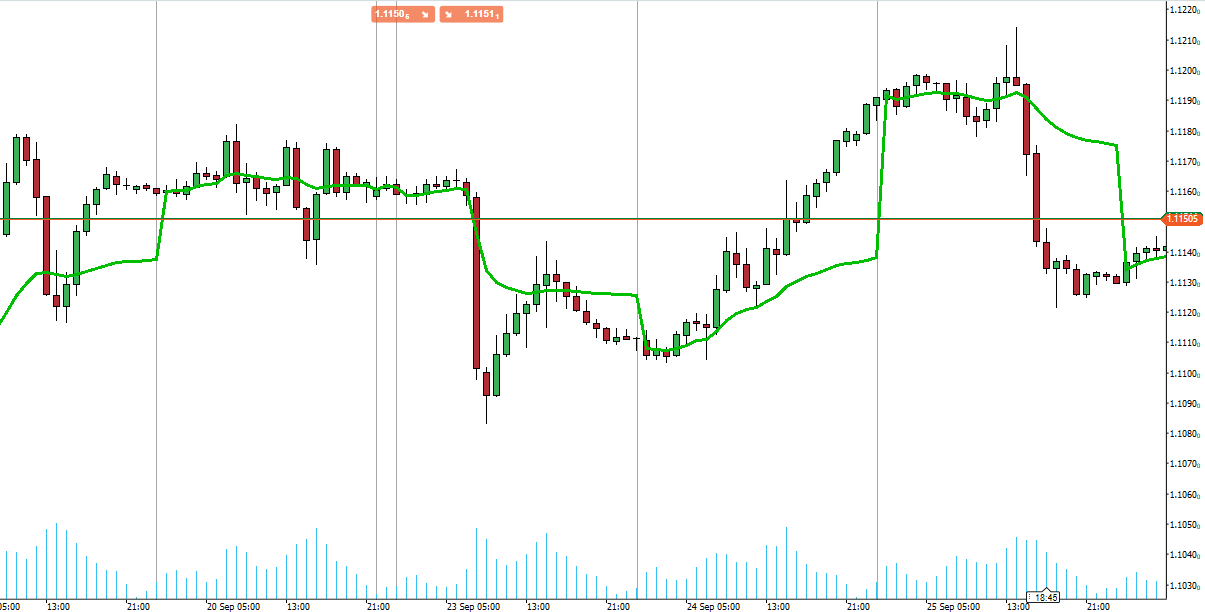
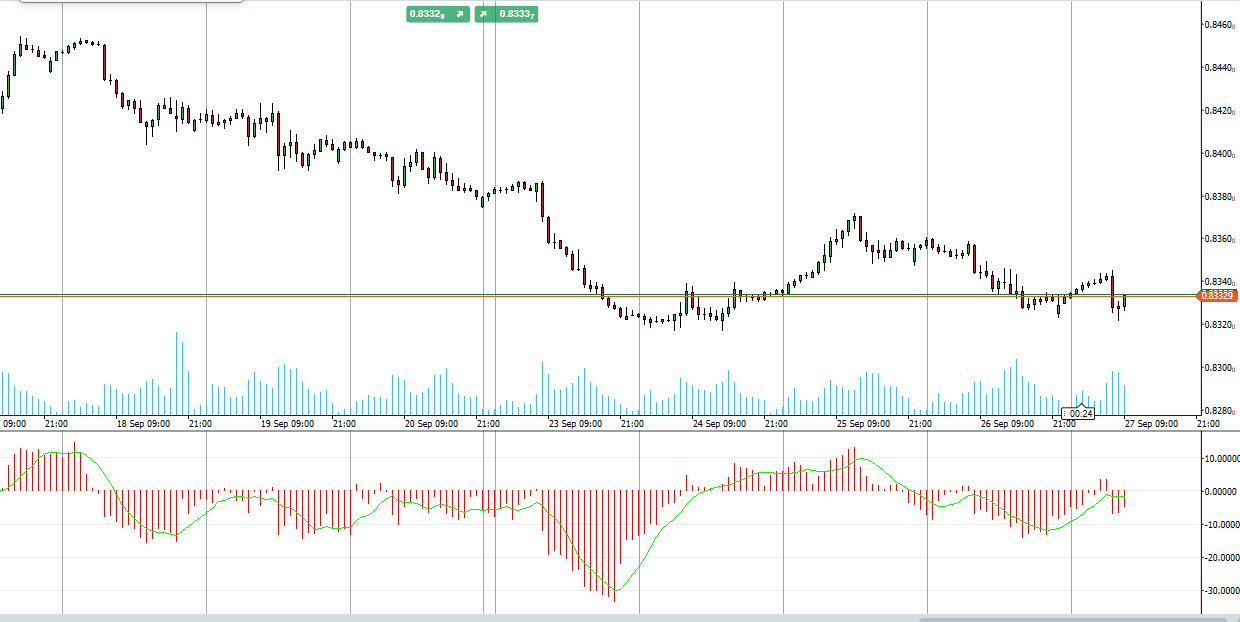
This powerful tool overlays the RSI directly onto the Stochastic RSI, providing a comprehensive view of market momentum. It highlights overbought and oversold areas with distinct coloring for easy identification.

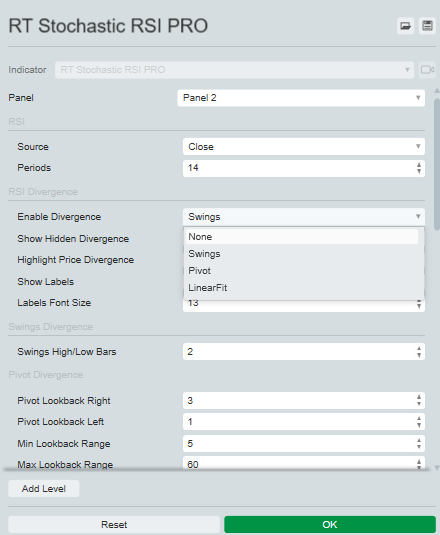
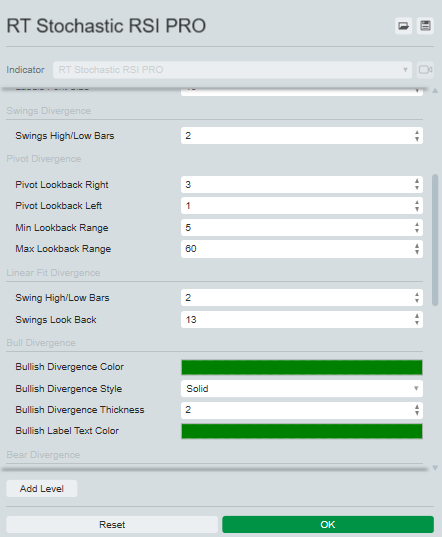
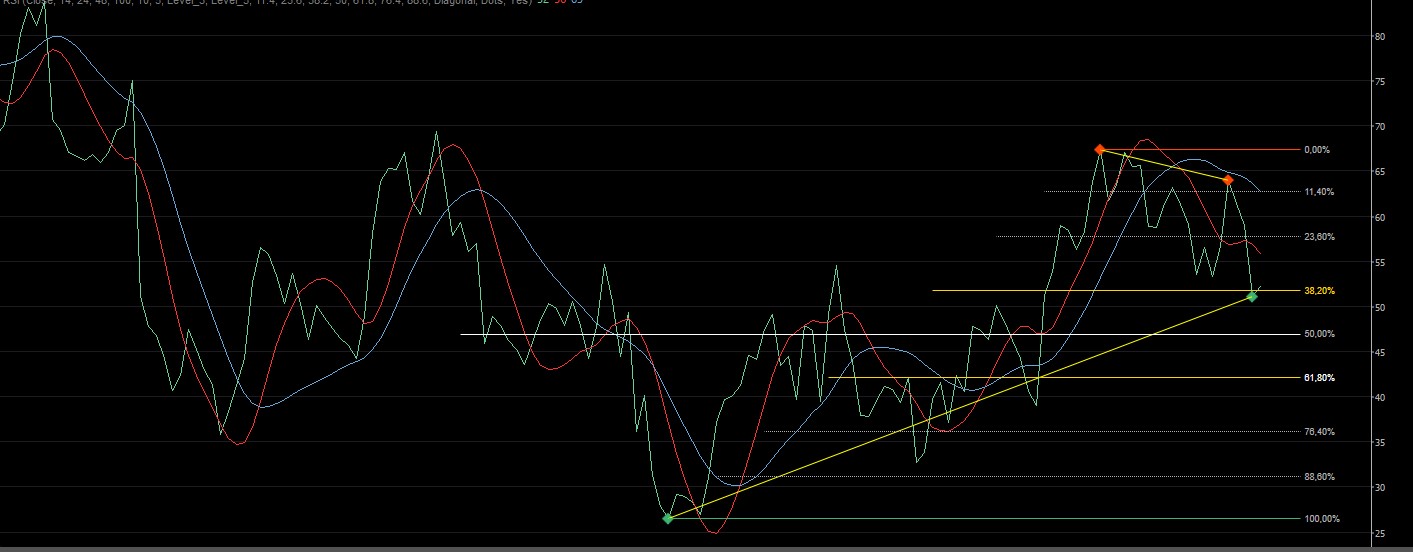
The standout feature of Stochastic RSI PRO is its ability to identify and optionally highlight both regular and hidden divergences on the chart. You can choose from three methods for identifying divergences: Swing, Pivot, or Linear Fit, each with customizable settings to match your trading strategy.

Elevate your analysis and decision-making with Stochastic RSI PRO, a must-have tool for discerning traders.

More from this author
RT MACD
Customize the MACD! Choose colors, get real-time tick updates, and see crossover points for enhanced trading precision.
RT VWAP
Unlock VWAP in cTrader! Choose anchor periods, price sources, and display deviation bands with real-time tick updates.
RT Chandelier Exit
Optimize exits with Chandelier Exit! Visualize stop-loss points dynamically for improved trading precision and safety.
Indicator
breakout
atr
RT ATR Bands
Enhance trading with ATR Bands! Visualize market volatility using dynamic upper and lower ATR bands for precise decision
RT TradingView ATR
Upgrade to ATR-RMA! Experience the precise ATR using Relative Moving Average for accurate volatility analysis in cTrader
Indicator
bollinger
RT Qualitative Quantity Estimation
Unlock trading precision with QQE! Dual QQE indicators with a Bollinger Bands zero line provide clear buy/sell signals.
Indicator
breakout
RT Consolidation Zones
Identify and trade breakouts with Consolidation Zones! Visualize price consolidation areas for trading opportunities.
Indicator
indices
RT True Strength Index
Enhance trading with TSI! Use the True Strength Index for clear insights into market momentum and trend strength.
Indicator
breakout
RT Standard Deviation Channel_noSourceCode
Visualize trends with Standard Deviation Channel! Display median, and add customizable upper/lower deviation channels.
RT Moving Average PRO v1.1
Customize your Moving Average! Choose any timeframe and price source for precision and flexibility in your analysis.
RT MACD Histogram
Enhance MACD Histogram! Visualize bull and bear price changes with vibrant colors for clearer, more insightful trading.
RT Relative Moving Average
Bring the RMA to cTrader! This is the Relative Moving Average from TradingView.
Indicator
breakout
bollinger
RT Bollinger Bands Cloud
Visualize Bollinger Bands with a colored cloud for clarity. Enhance your trading precision with this dynamic indicator!
RT Time Segmented Volume
Enhance trading with TSV! Analyze volume flow and price trends using the powerful Time Segmented Volume indicator.
You may also like
Ichimoku Kinko Hyo
Ichimoku Kinkō Hyō with fixed shift to 25 as Ctrader calculate it from 0 and values was wrong for Chikou Span and Kumo.
Indicator
breakout
PDHL
PDHL - Previous Day High&Low
Indicator
forex
eurusd
EconomicForex
ECONOMIC FOREX:provides insights into inflation, nominal interest rates and real interest rates, in the line chart
Zigzag T3
Three ZigZag lines
Indicator
forex
eurusd
usdjpy
4 Currencies V2_NSC
Relative Currency Strength 4 Currencies: AUD USD EUR JPY
Wstęgi DoubleSMMA
Wstęgi HTS
FiboTrend-Pro V2
New version of one of my favorites includes Fibonacci and moving average convergence divergence lines
Session Highlight Framer
Frame the sessions
EMA_RTH
Custom period EMA
BSL_SSL_Liqudity
Buy-Side & Sell-Side Liquidity (BSL/SSL) Indicator
Series - FXMaster
Consecutive Series Moves — Reveal the True Pulse of Price Action
Indicator
forex
indices
eurusd
+1
DXY w HMA
DXY HMA Indicator
AlgoCorner 1-100 Moving Averages
Draw as many Moving Averages as you need from a simple indicator.
True Trend H4
It draws a step line that visualize the movement of H4. Particularly effective when trade on lower timeframe.
KDJ
The KDJ oscillator display consists of 3 lines (K, D and J - hence the name of the display) and 2 levels.
Zero Lag Exponential Moving Average
ZLEMA (Zero Lag EMA) is a faster, smoother version of EMA, ideal for capturing quick market shifts and trends.
Indicator
breakout
VegaXLR - Fixed Range Volume Profile
Identify key support and resistance levels through detailed volume distribution analysis.
Indicator
breakout
btcusd
supertrend
+6
Order Block
Identify bullish and bearish Order Blocks to spot key support/resistance levels and potential trend reversals! 📈🔄