!["[Stellar Strategies] Market Session Ultimate" logo](https://market-prod-23f4d22-e289.s3.amazonaws.com/92b85b76-697c-4a8f-811f-ddd63eb8f9c8_cTrader_oSHtUgCtNJ.png)
!["[Stellar Strategies] Market Session Ultimate" uploaded image](https://market-prod-23f4d22-e289.s3.amazonaws.com/3ebb1f19-4f7a-44bf-8eaa-a17cb6a20392_cT_cs_4141285_EURUSD_2025-04-12_21-30-50.png)
!["[Stellar Strategies] Market Session Ultimate" uploaded image](https://market-prod-23f4d22-e289.s3.amazonaws.com/f77000e9-e240-46b8-9d08-3476474b703e_cT_cs_4141285_EURUSD_2025-04-12_21-34-48.png)
!["[Stellar Strategies] Market Session Ultimate" uploaded image](https://market-prod-23f4d22-e289.s3.amazonaws.com/ace833ba-a81f-497a-8c52-4e196d3fc5c9_cTrader_Bwet7aK2Yi.png)
!["[Stellar Strategies] Market Session Ultimate" uploaded image](https://market-prod-23f4d22-e289.s3.amazonaws.com/e991684f-30b7-40ff-b3fb-951d186c1817_cTrader_VWT2c7hzaf.png)
!["[Stellar Strategies] Market Session Ultimate" uploaded image](https://market-prod-23f4d22-e289.s3.amazonaws.com/c3ca8104-f022-47a3-b67f-ab5406579acd_cTrader_osilwufEEV.png)
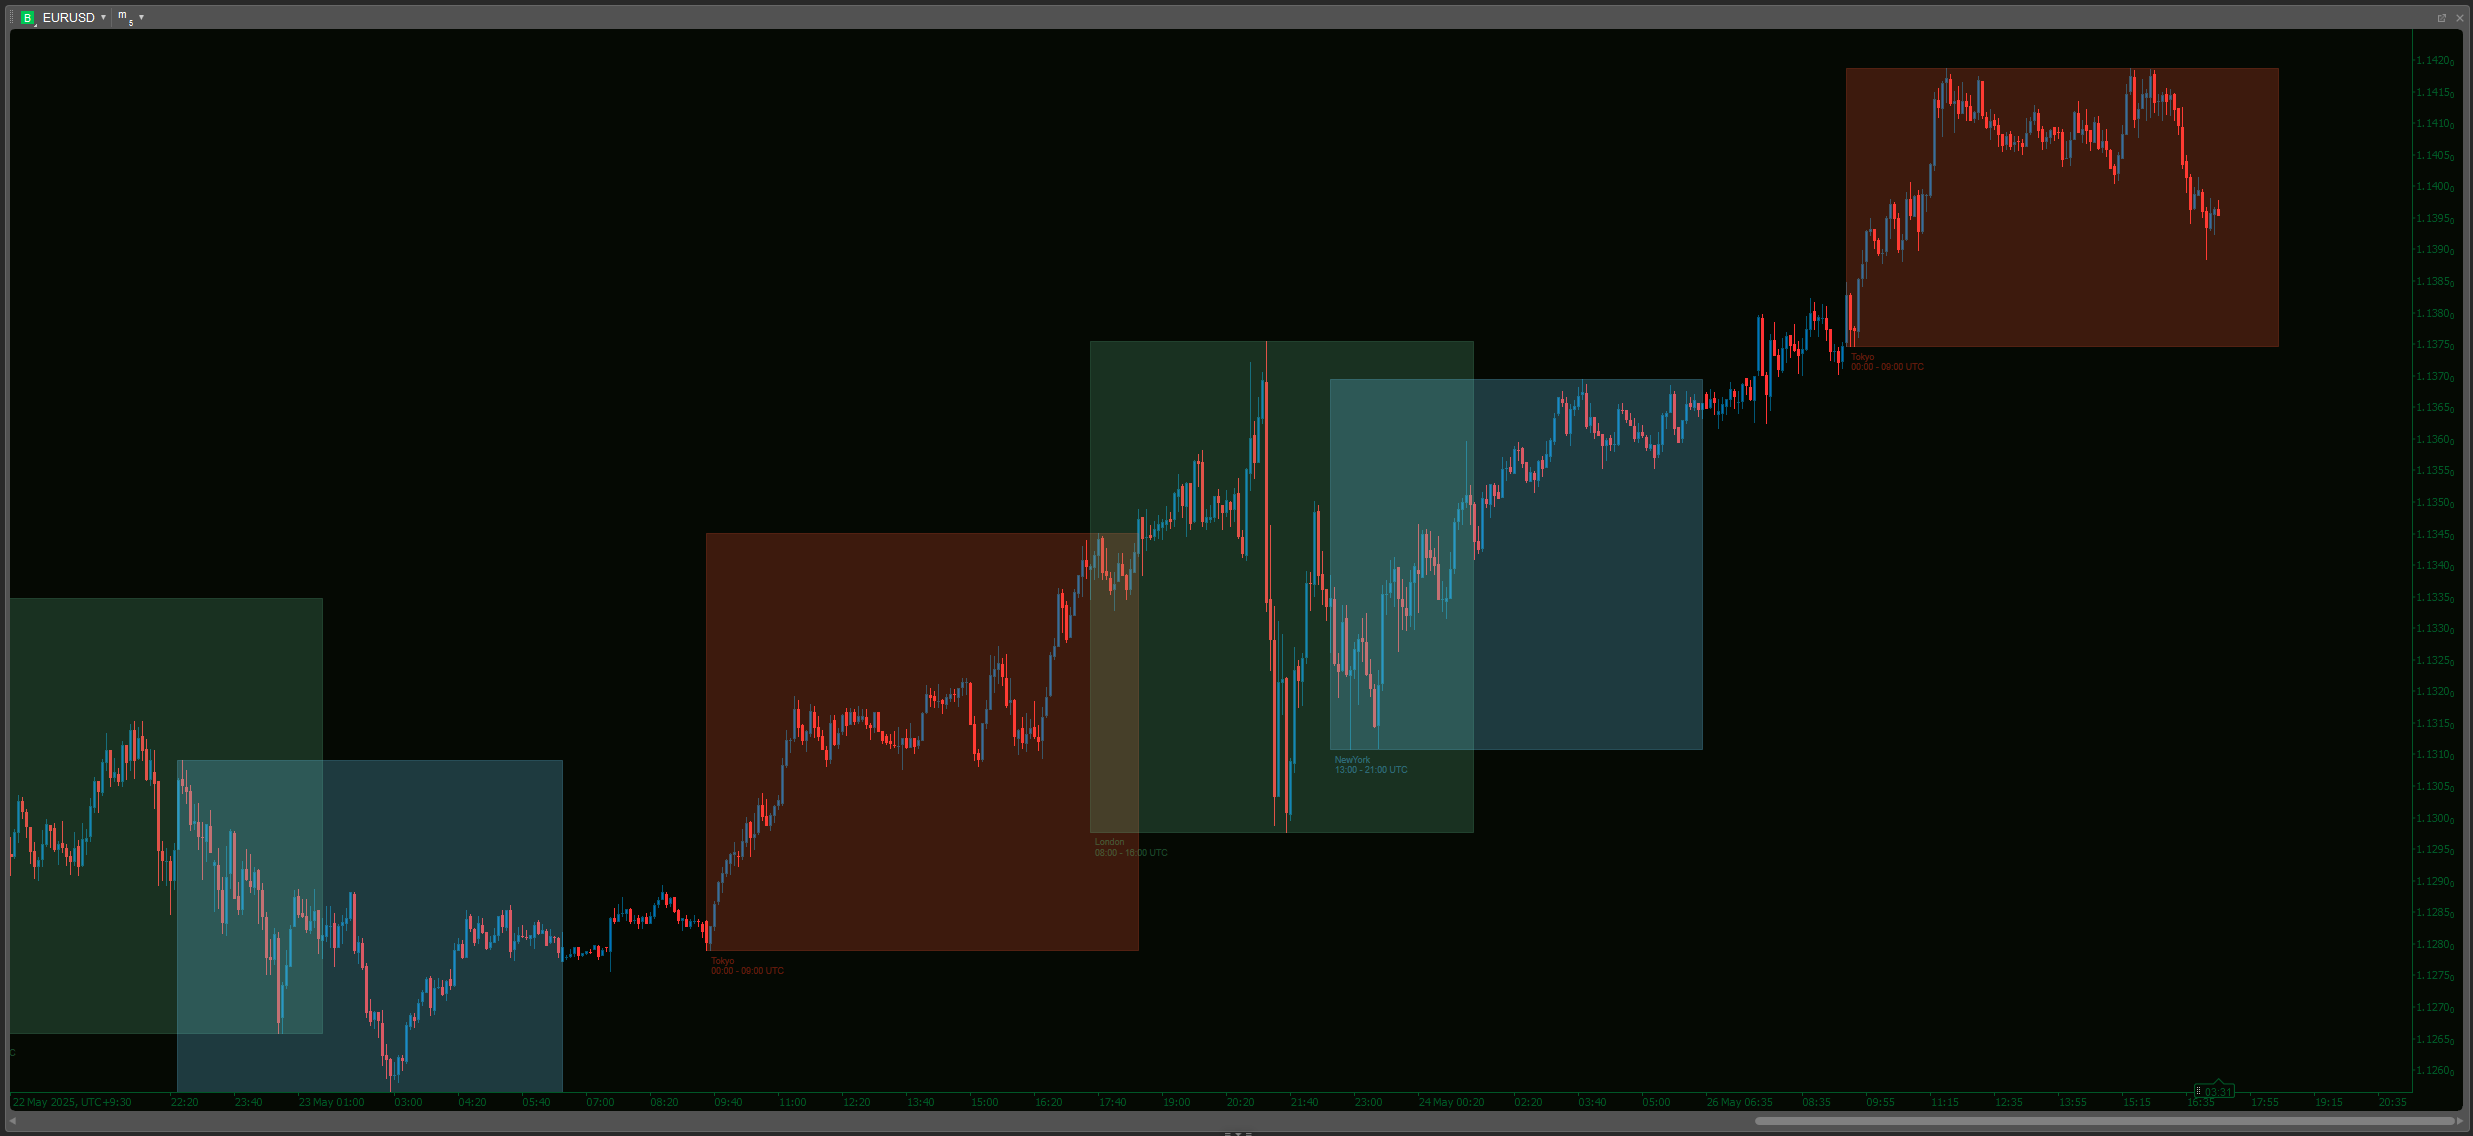
Market Session Ultimate - Visualize the Trading Day Like Never Before!
Take control of your session-based trading with Market Session Ultimate for cTrader! This comprehensive indicator combines multiple essential tools into one powerful, highly customizable package, designed to give you a clear edge by visualizing key time zones, price levels, and market information directly on your chart.
Stop cluttering your charts with multiple indicators – Market Session Ultimate provides the context you need in one place.
Core Features:
- Customizable Session Boxes: Display Sydney, Asia, London, and New York sessions.
- Individually enable/disable each session.
- Set custom Start Times and Durations (in hours). (See Important Note on Times below)
- Choose unique Colors for each session.
- Optional background Fill with adjustable global Opacity.
- Customize Box Line Style and Thickness.
- Custom Display Names: Label sessions exactly how you want (e.g., "Tokyo", "Frankfurt", "NYC").
- Essential Session Levels:
- Automatically plots session High and Low levels.
- Optional display of session Mid-Point line.
- Optional display of session Open line.
- Optional extension of session High/Low lines beyond the session close.
- Key Time-Based Zones:
- Opening Range (OR): Enable and configure OR for each session (Duration in minutes), with customizable line style and optional extension of OR H/L lines.
- Kill Zones (KZ): Highlight potential volatility windows around London & New York opens with configurable Start Offset, Duration, and Color.
- Overlap Highlight: Clearly visualize the high-liquidity London/New York overlap period with a distinct, customizable background color.
Advanced Levels & Context:
- Previous Day Levels: Plot the previous trading day's High, Low, Open, and Close levels across the current day – critical reference points for support and resistance. Includes optional text labels (PDH, PDL, etc.). Fully customizable color, style, and thickness.
Informative Display Panel:
- Configurable Info Panel: A clean, static display panel in your chosen chart corner (TopRight, TopLeft, BottomRight, BottomLeft) with customizable text color.
- Selectable Data: Choose exactly what you want to see:
- Trading Pair Name
- Current Spread (pips)
- Latest Active/Completed Session Name
- Latest Session Range (pips)
- Distance from latest Session High (pips)
- Distance from latest Session Low (pips)
- Time Remaining in current active session (e.g., "Ends in: 1h 25m")
- Current Daily Range (pips)
Usability & Customization:
- Master Enable/Disable: Quickly toggle all indicator visuals on or off with a single click.
- History Limiter: Control how many past days of sessions are displayed (
DaysToShow) to keep your chart clean. - Global Line Styles: Customize the appearance (Color, Style, Thickness) for all Mid Lines, Open Lines, and Opening Range lines globally.
--- Important Note on Session Times & DST ---
- The Session "Start Time" parameters (e.g., "08:00", "14:00") are interpreted based on the indicator's internal TimeZone setting, which is fixed at GMT / UTC (GMT Standard Time) for consistency across different broker servers.
- This indicator does not automatically adjust for Daylight Saving Time (DST) changes that occur in the actual financial centers (like London, New York, Sydney).
- You MUST manually adjust the "Start Time" parameters in the indicator settings when DST changes affect the GMT/UTC equivalent of the local market open/close you want to track.
- Example: London typically opens at 8:00 AM local time. During winter (GMT), you set London Start Time to "08:00". When London switches to British Summer Time (BST = GMT+1), their 8:00 AM local open happens at 07:00 GMT/UTC. To keep the box aligned, you would need to change the London Start Time parameter to "07:00". Similar adjustments are needed for New York's DST shifts.
- Please verify the correct GMT/UTC times for your desired session openings during DST periods and update the parameters accordingly for accurate visualization.
---
Why Market Session Ultimate?
This indicator consolidates the functionality of multiple tools – session boxes, opening range indicators, previous day level indicators, and market info displays – into one efficient and highly configurable package. Gain deeper market context, identify key levels faster, and keep your charts cleaner. Perfect for intraday traders focusing on session dynamics.
!["[Stellar Strategies] BOS Trend 1.0" logo](https://market-prod-23f4d22-e289.s3.amazonaws.com/808c7722-ba53-4633-b8a4-16f31eeb1fc2_[Stellar Strategies] BOS Trend.jpg)
!["[Stellar Strategies] MARSI Signal Plotter" logo](https://market-prod-23f4d22-e289.s3.amazonaws.com/ce01bd9f-8907-48d9-a68d-7c0bde6b9704_4aDZjo80P5.png)
!["[Stellar Strategies] Market Structure Breakout" logo](https://market-prod-23f4d22-e289.s3.amazonaws.com/99d762b3-fbbe-489d-9c19-e72c41ffe387_cT_cs_4141285_EURUSD_2025-04-21_20-25-12.png)
!["[Stellar Strategies] Inside Bar with Signals" logo](https://market-prod-23f4d22-e289.s3.amazonaws.com/c12d088e-7b52-4961-a0d2-7e38a2499bd3_cT_cs_4141285_EURUSD_2025-07-15_13-15-32.png)
!["[Stellar Strategies] Wave Trend Pro" logo](https://market-prod-23f4d22-e289.s3.amazonaws.com/8c93438a-6b0a-4026-93b2-0694329a3bc1_cT_cs_4141285_EURUSD_2025-04-25_17-52-31.png)
!["[StellarStrategies] Scheduled Trade Executor" logo](https://market-prod-23f4d22-e289.s3.amazonaws.com/f13e96a0-274f-490e-8aa5-5a154d8bcf60_stellar12.jpg)
!["[Stellar Strategies] Linear Regression Candles 1.1" logo](https://market-prod-23f4d22-e289.s3.amazonaws.com/19ef277f-e0b6-48ef-8941-88bfbba145f3_cT_cs_4141285_EURUSD_2025-03-30_19-53-31.png)
!["[Stellar Strategies] Visual Trend Momentum" logo](https://market-prod-23f4d22-e289.s3.amazonaws.com/3835d044-1c21-4909-9d3c-2635f984b93d_visualtrendmomentum.jpg)
!["[Stellar Strategies] QQE" logo](https://market-prod-23f4d22-e289.s3.amazonaws.com/ed4b3af5-54e4-404e-80eb-a23fa7ef0282_cTrader_7oDDAbSmSP.png)
!["[Stellar Strategies] Moving Averages Combined 1.0" logo](https://market-prod-23f4d22-e289.s3.amazonaws.com/b4cd360c-5f3c-4902-b2e1-6b86da1199bb_Gemini_Generated_Image_nl1erpnl1erpnl1e.jpg)
!["[Stellar Strategies] SP500 Gap Closure cBot 1.0" logo](https://market-prod-23f4d22-e289.s3.amazonaws.com/62a77232-02a9-423b-a5e4-bd2c2bc8db97_cT_cs_4141285_US500_2025-03-21_17-12-57.png)
!["[Stellar Strategies] Ultimate Trend & Momentum Dashboard" logo](https://market-prod-23f4d22-e289.s3.amazonaws.com/d8a894f3-34df-4f37-b4a3-c37e971e4e1f_cT_cs_4141285_NAS100_2025-06-24_17-12-20.png)
!["[Stellar Strategies] Market Regime Filter" logo](https://market-prod-23f4d22-e289.s3.amazonaws.com/cb84a98c-46f6-4cfd-b0ba-16518a618cb1_cT_cs_4141285_EURUSD_2025-04-20_16-50-30.png)