Get cTrader
Start trading
cBots
Indicators
Plugins
Brokers & Props
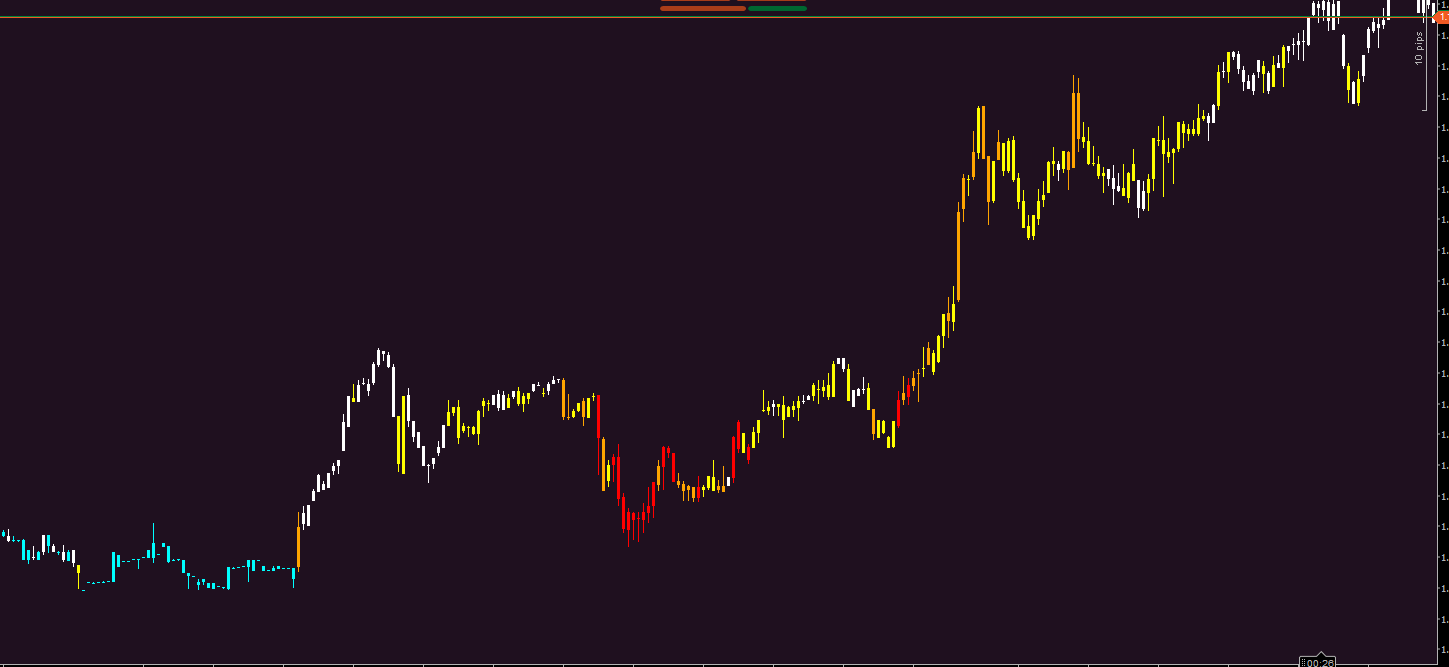
Indicator
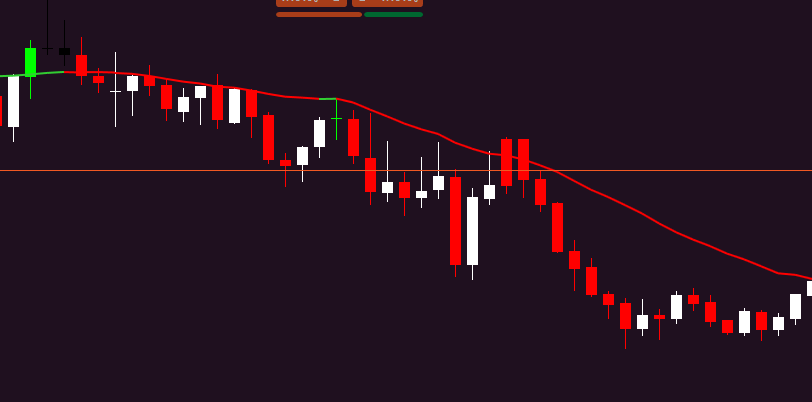
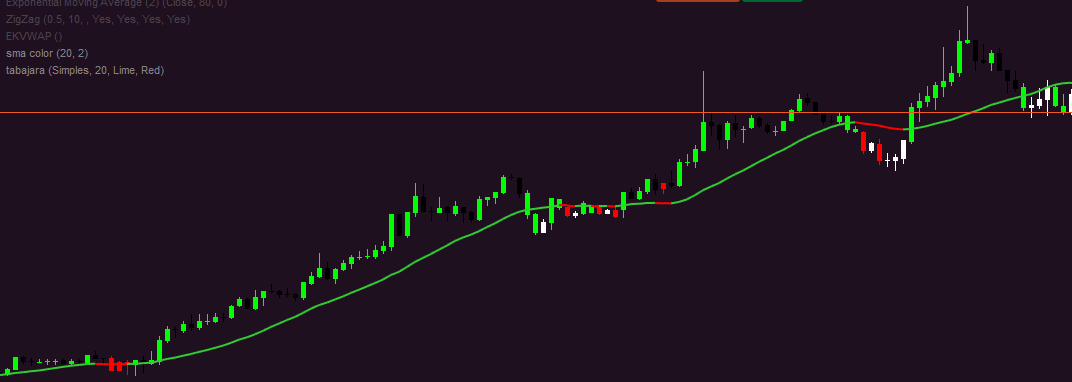
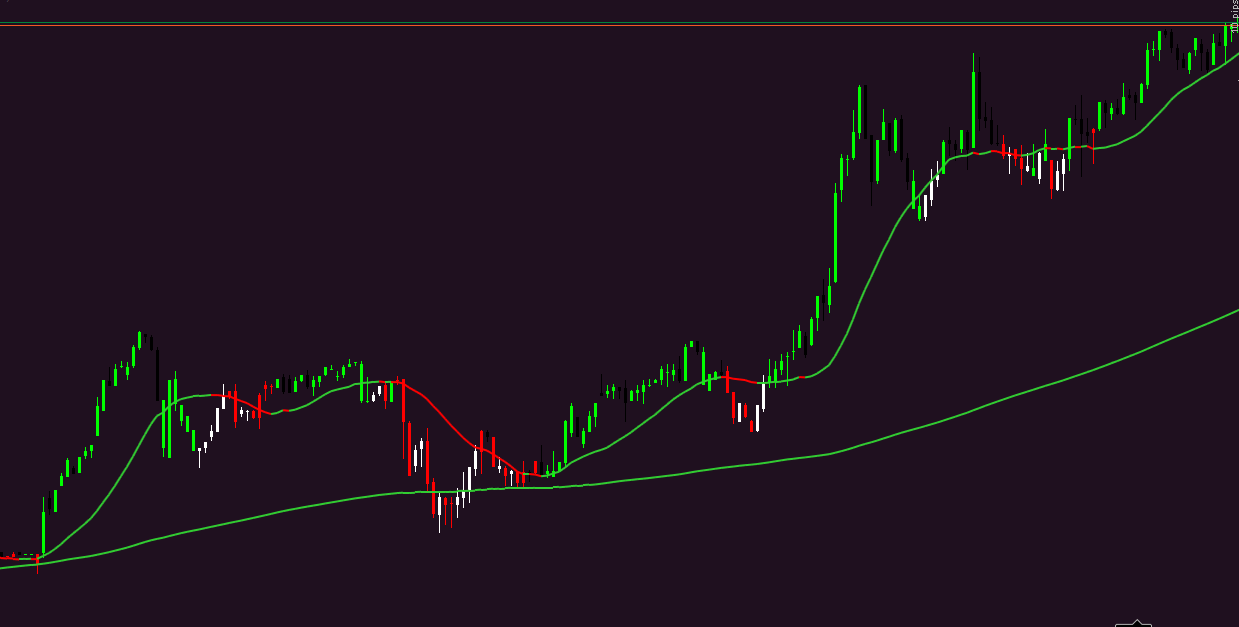
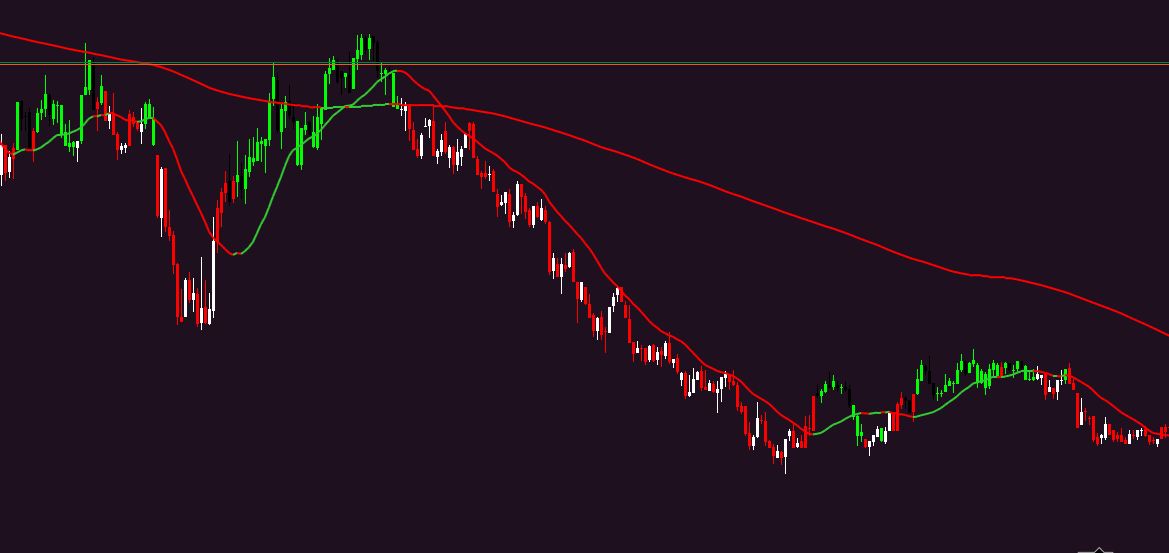
sma color
Share
03/09/2025
75
Desktop
Felipe.SC97
Since 10/02/2025
Free installs
477
Description
Customer reviews
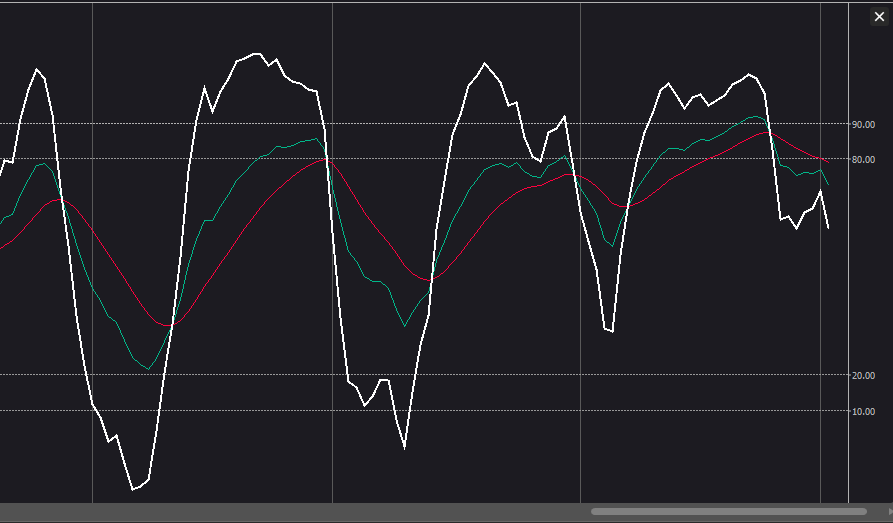
sma color
Expand
More from this author
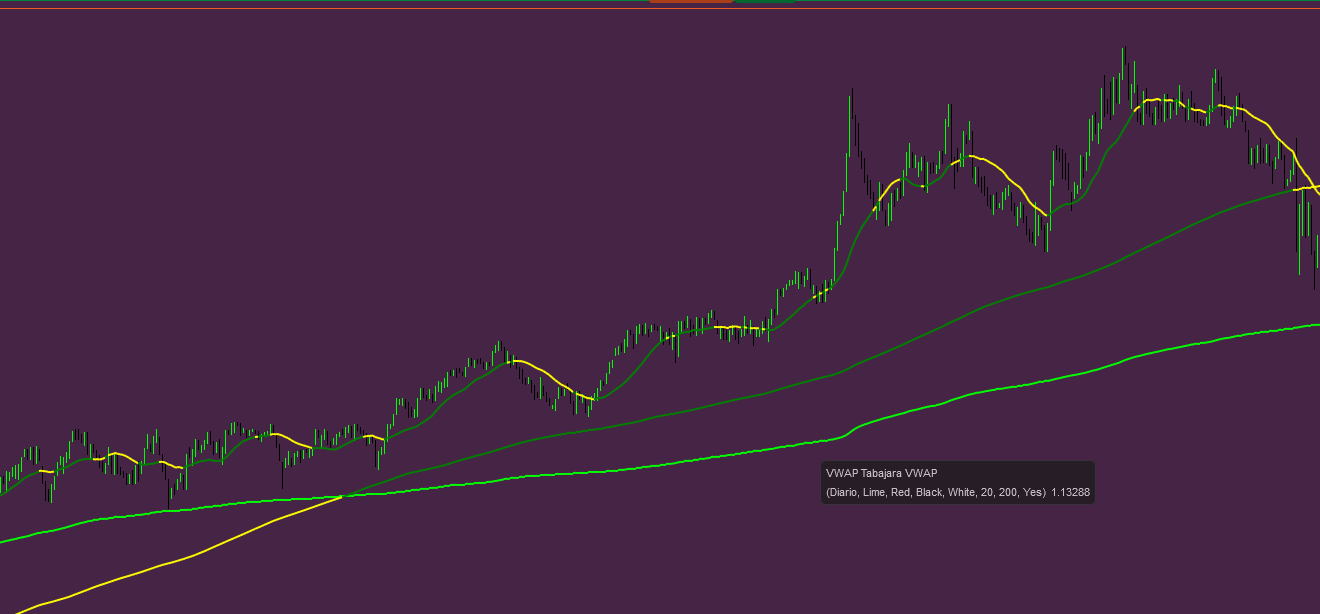
VWAP Tabajara
Felipe.SC97
5.0
(1)
Free
Indicator
VWAP
VWAP Tabajara
VWAP Tabajara
Free
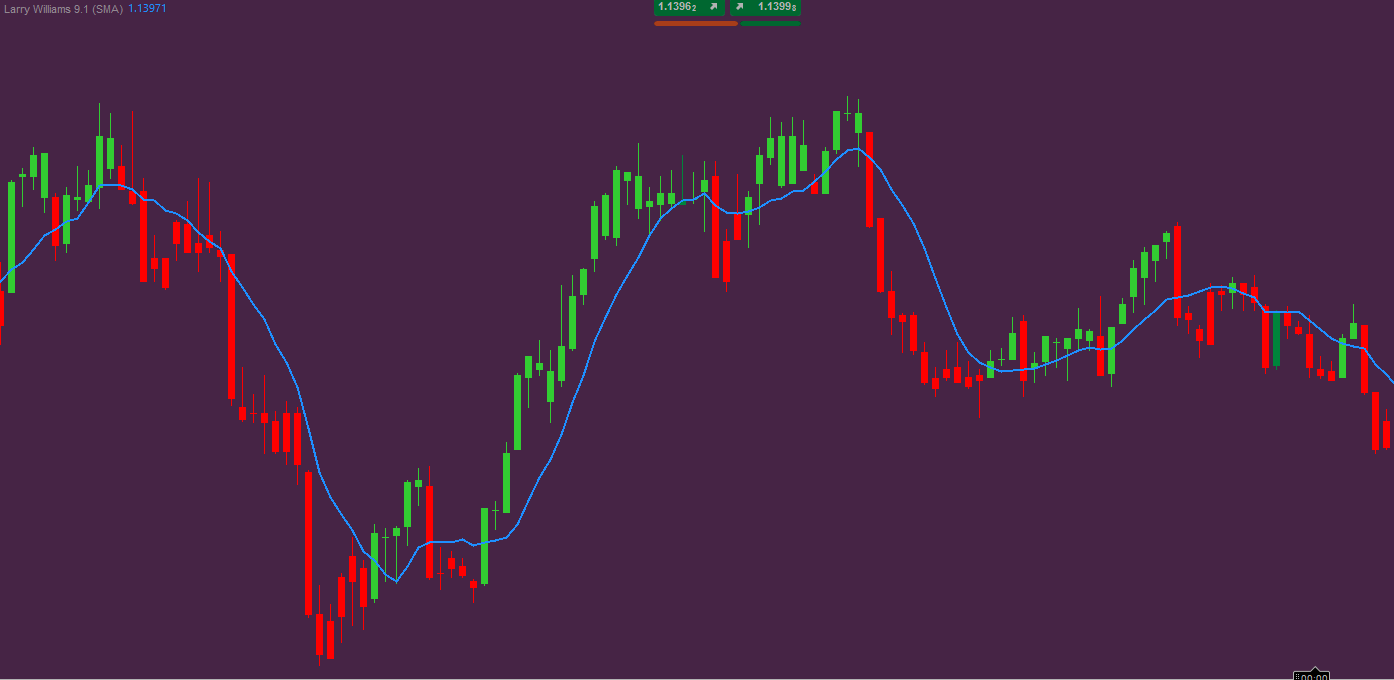
Larry Williams 9.1
Felipe.SC97
Free
Indicator
Larry Williams 9.1
Larry Williams 9.1
Free
HeatMap Candle
Felipe.SC97
Free
Indicator
HeatMap Candle
HeatMap Candle
Free
HTFOverlayPlus
Felipe.SC97
Free
Indicator
HTFOverlayPlus
HTFOverlayPlus
Free
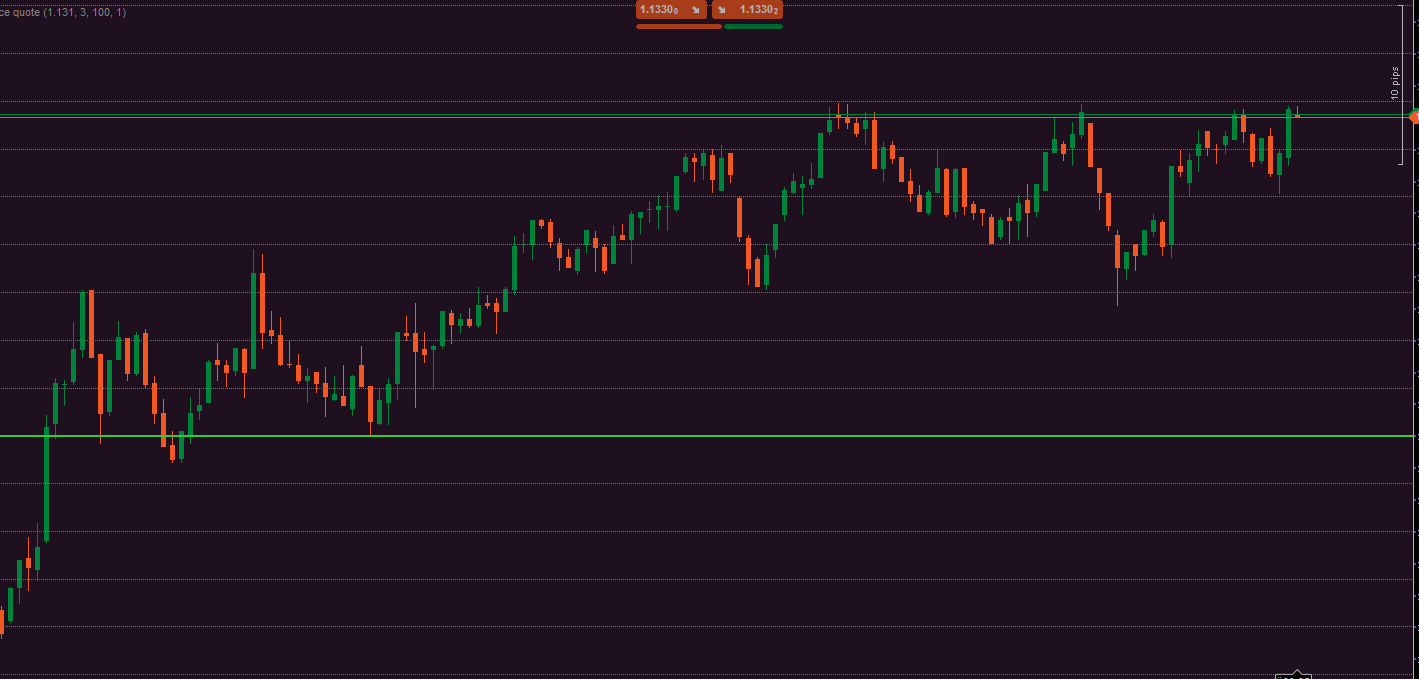
price quote
Felipe.SC97
Free
Indicator
price quote
price quote
Free
Tabajara corrigido[fix]
Felipe.SC97
Free
Indicator
Tabajara corrigido[fix]
corrigido todos os bugs e cores invertidas tabajara antigo deleetado
Free
You may also like
Popular
cAlgoBuddy - Chaos Reversals
cAlgoBuddy
$ 20
Indicator
Indices
XAUUSD
Commodities
+5
cAlgoBuddy - Chaos Reversals
The cTrader Chaos Reversals indicator brings high-quality reversal signals to traders.
$ 20
Popular
BSL_SSL_Liqudity
Dineshkumar_FX
$ 30
/
$50
Indicator
NAS100
Indices
XAUUSD
+4
BSL_SSL_Liqudity
Buy-Side & Sell-Side Liquidity (BSL/SSL) Indicator
$ 30
/
$50
New
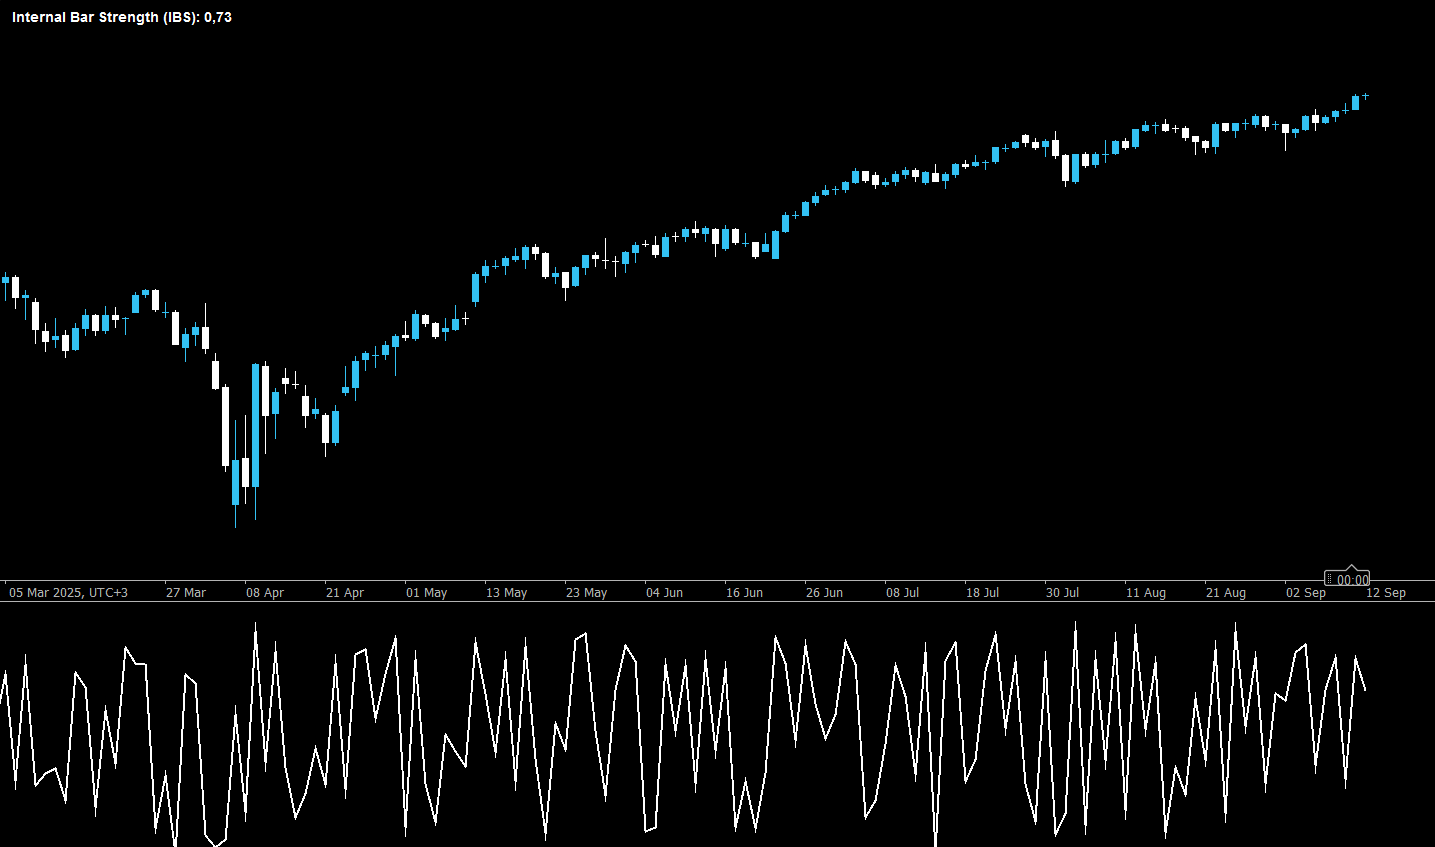
IBS Indicator
aggelospr2125
$ 12
Indicator
Indices
Breakout
Prop
+9
IBS Indicator
IBS Indicator – Measures price position within bars for smarter trades. Works on all markets & timeframes.
$ 12
Popular
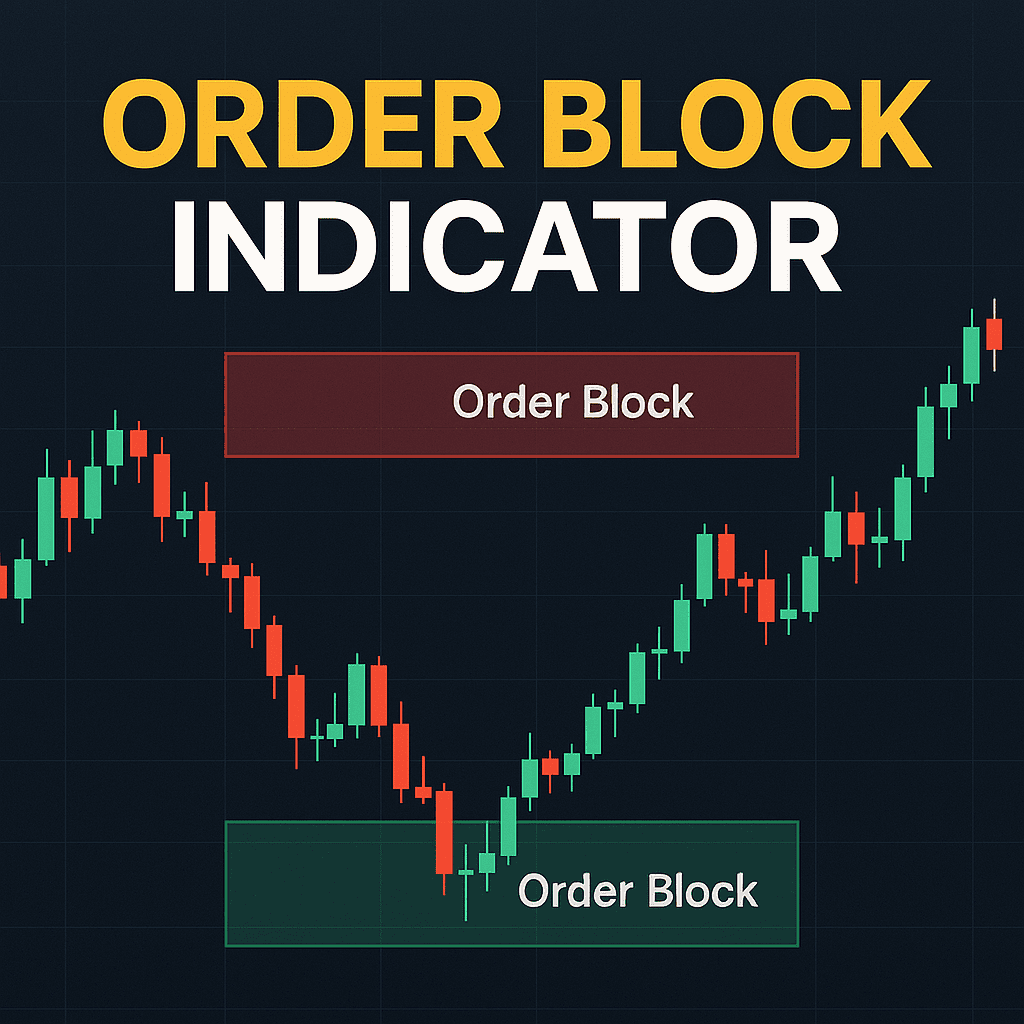
Order Block Detector SmartTrading
JeissonFranco
$ 10
/
$15
Indicator
Order Block Detector SmartTrading
🎯 Order Block Detector - Smart Trading: Identifica bloques de órdenes clave en cTrader para un trading más inteligente.
$ 10
/
$15
Big Candel
Forever_denisa
$ 30
/
$50
Indicator
Big Candel
1 Candel High Time Freme
$ 30
/
$50
Popular
[Stellar Strategies] Market Session Ultimate
StellarStrategies
4.5
(2)
$ 10
/
$20
Indicator
[Stellar Strategies] Market Session Ultimate
Ultimate Session Tool: Boxes, OR, KZs, PD Levels, Overlaps, Custom Lines & Names, Info Panel! Highly customizable 📉📈
$ 10
/
$20
VWAP Tank Btn
yashtank1711
Free
Indicator
VWAP Tank Btn
Custom Vwap Indicator
Free
Popular
MARKET_STRUCTURE BOS_CHoCH
Dineshkumar_FX
$ 25
/
$50
Indicator
NAS100
XAUUSD
Commodities
+10
MARKET_STRUCTURE BOS_CHoCH
MarketStructurePro – Smart BOS/CHoCH
$ 25
/
$50
Top-rated
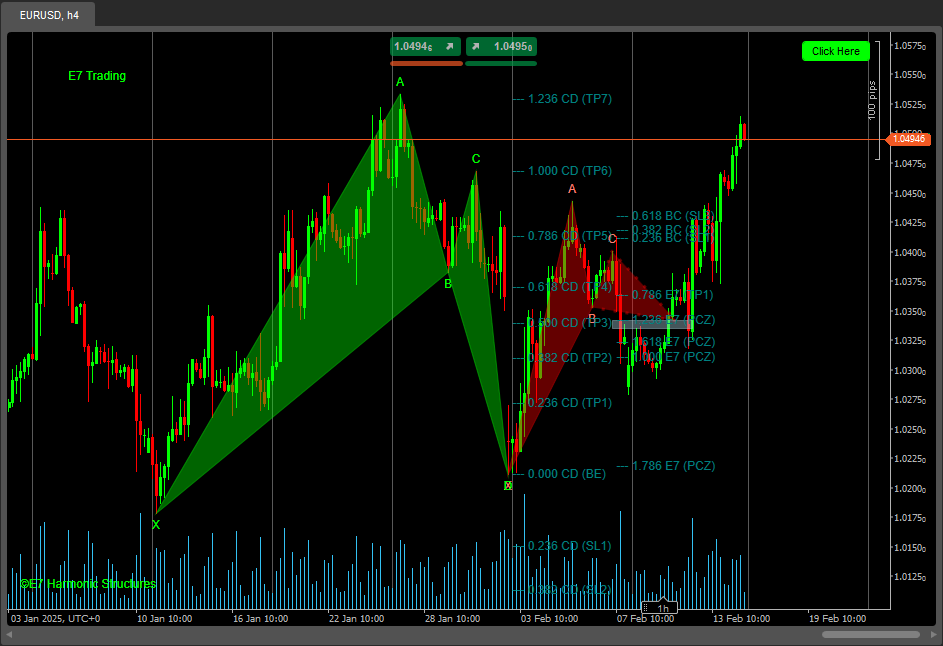
E7 Harmonic Structures Basic
Gwave
5.0
(2)
Free
Indicator
E7 Harmonic Structures Basic
E7 Harmonic Structures Basic.
Free
New
Time zone pro
miguelfk211
Free
Indicator
Indices
Breakout
Forex
+2
Time zone pro
FREE Global Trading Sessions Indicator
Free
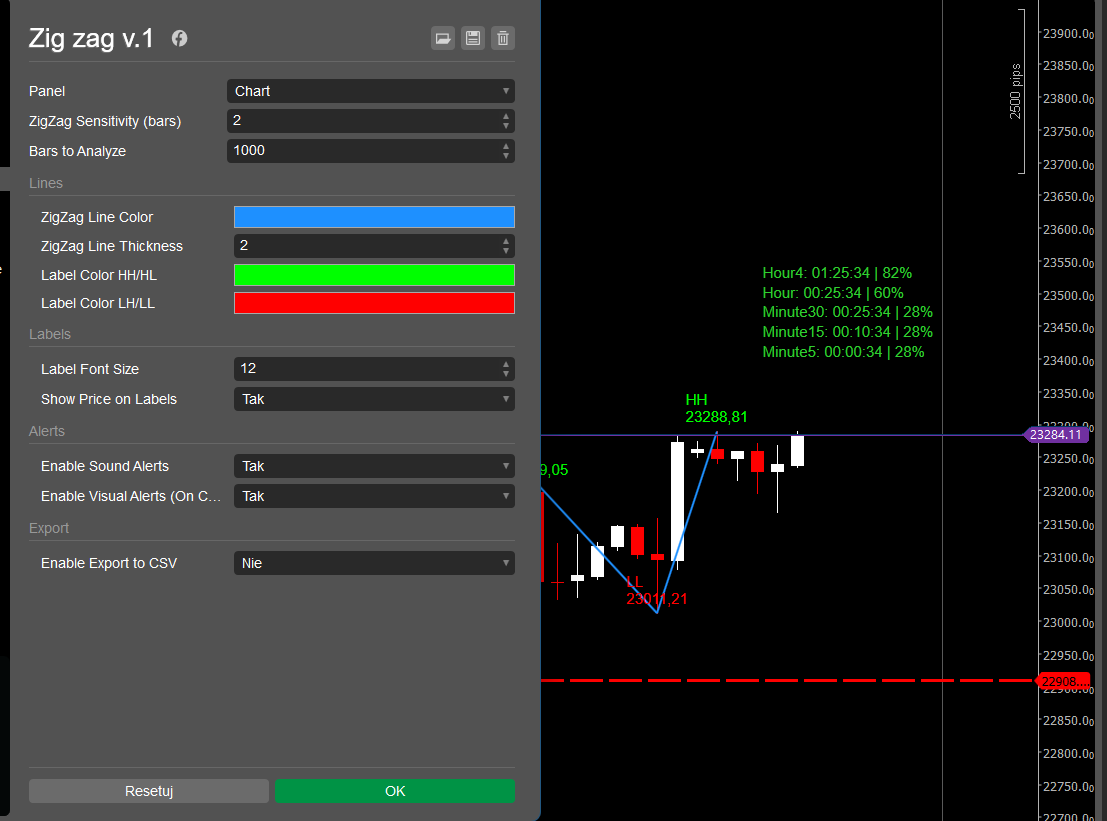
Zig zag v.1 Demo
kobud.222
Free
Indicator
Zig zag v.1 Demo
ZigZag Pro DEMO – Multi-Swing Indicator for cTrader DEMO VERSION – 24 hours free trial! This is a DEMO version of the Z
Free
KDJ
Investion
5.0
(1)
Free
Indicator
KDJ
The KDJ oscillator display consists of 3 lines (K, D and J - hence the name of the display) and 2 levels.
Free
New
ORDERFLOW_SKIA_Plynuly
BubakBubu
Free
Indicator
NAS100
NZDUSD
XAUUSD
+13
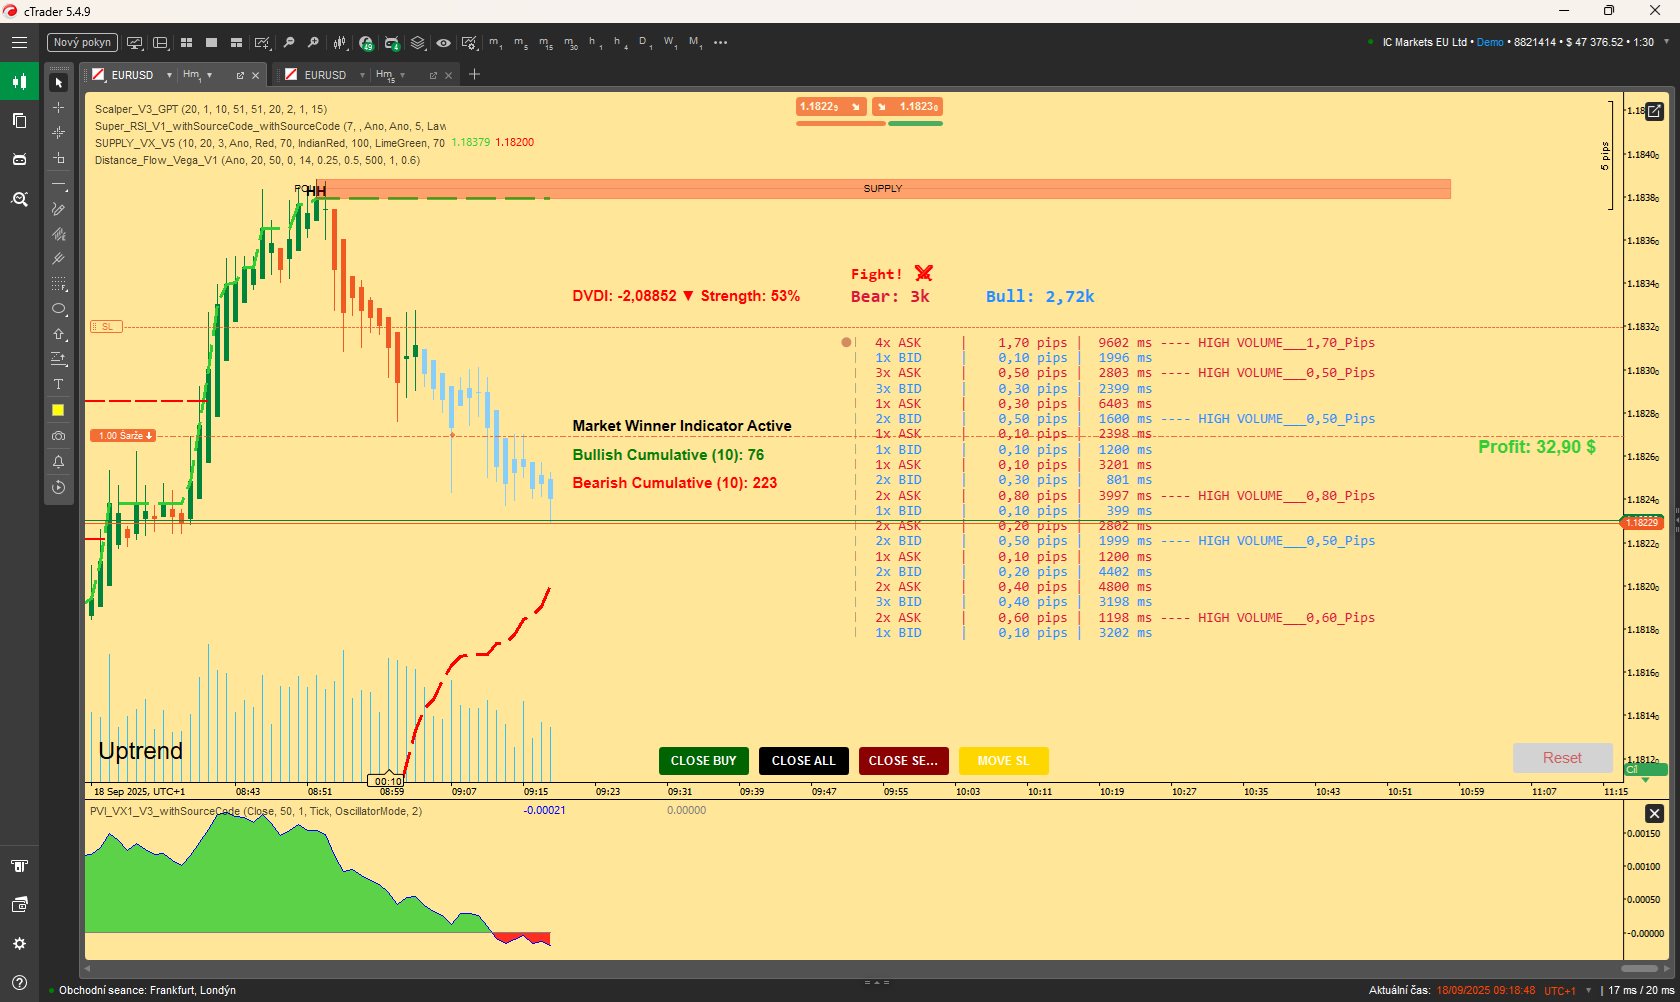
ORDERFLOW_SKIA_Plynuly
This Indicator will show you Direction, Distance, and Time;
Free
Top-rated
Open Trade PipsV1
lifeofmichaeltrading
4.5
(2)
Free
Indicator
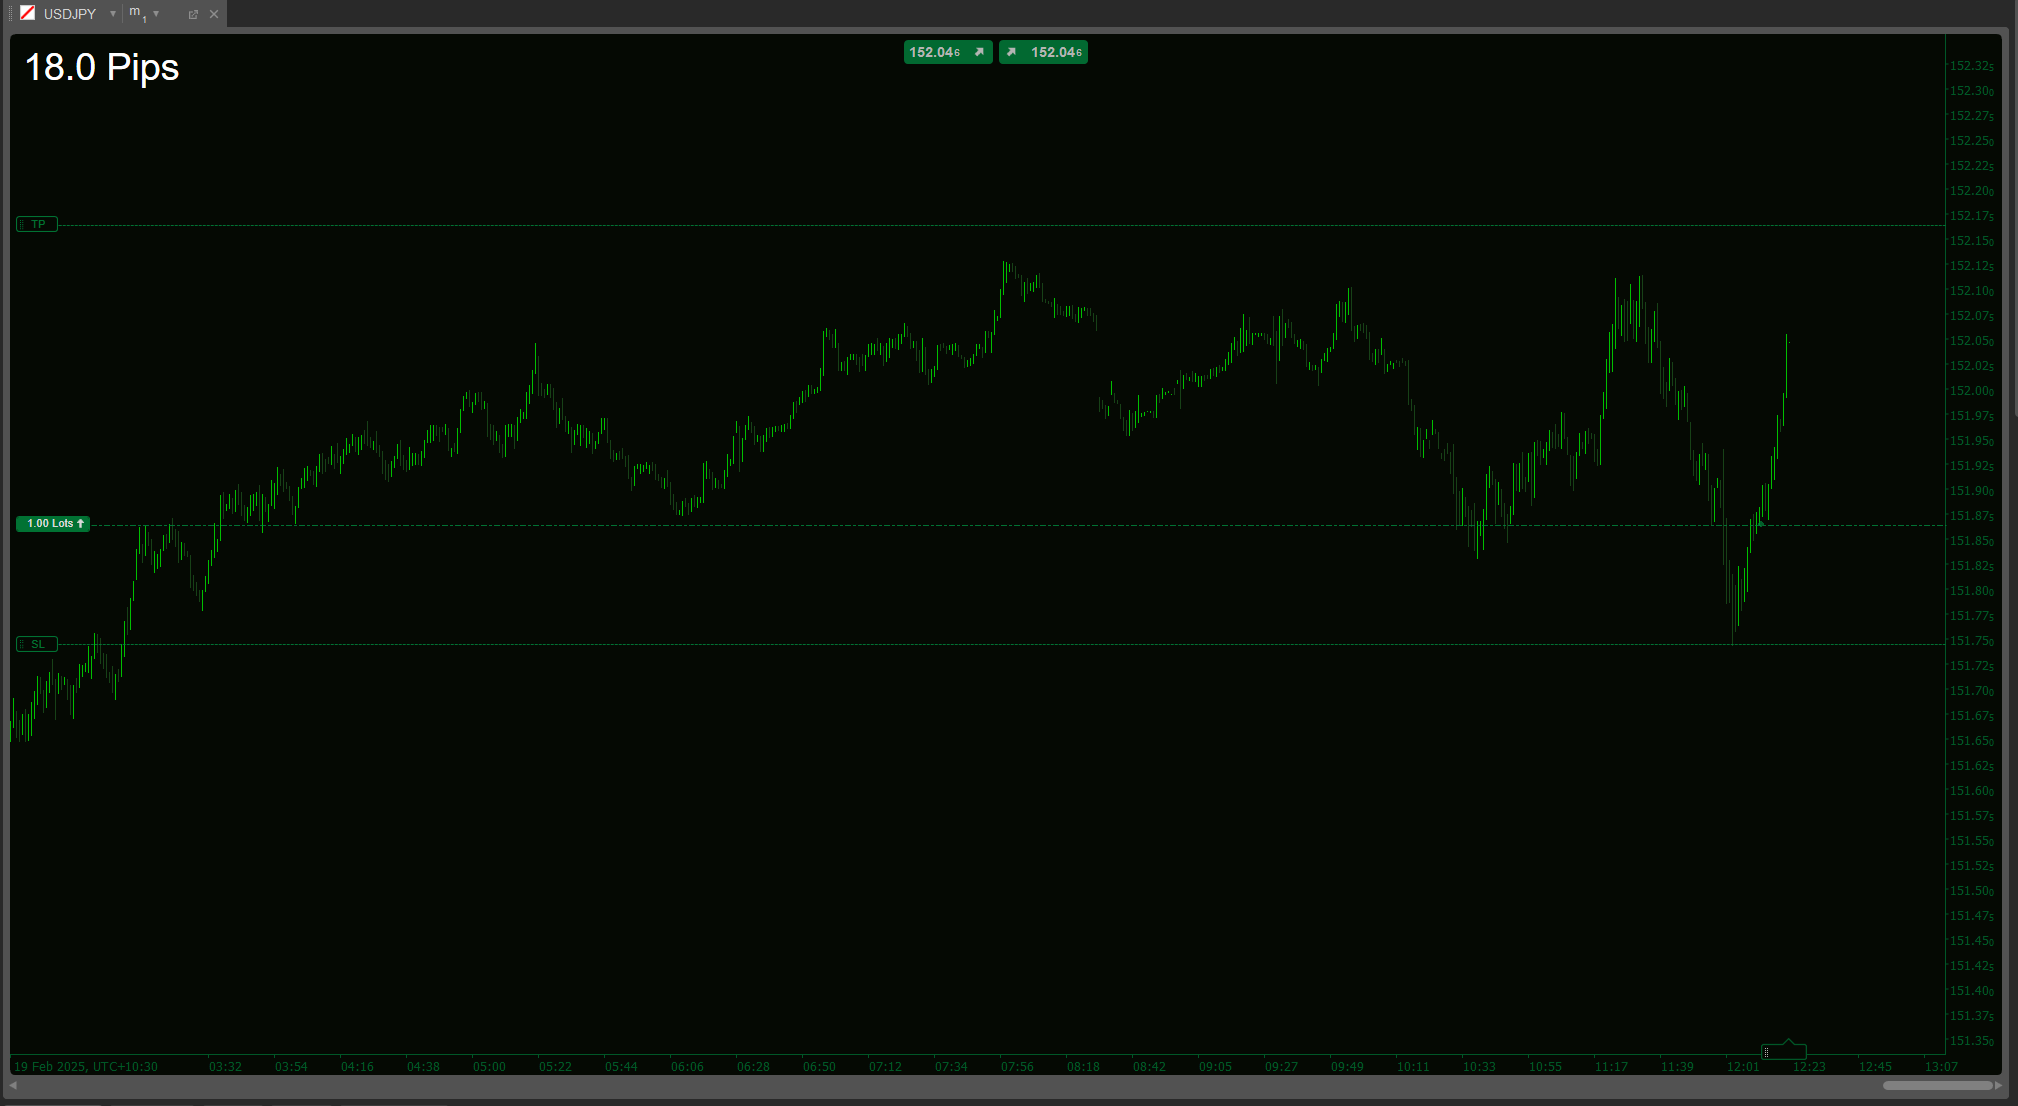
Open Trade PipsV1
This indicator tracks the unrealised amount of pips in your open positions.
Free
Popular
DOMFlowScalperPRO
traderKingDev
$ 10
Indicator
DOMFlowScalperPRO
Scalp smarter with DOM Flow Scalper PRO – real-time Bid/Ask imbalance and volume precision!
$ 10
Popular
Pivot Points Daily Session
pengzuyun
5.0
(1)
$ 15
/
$19
Indicator
Breakout
Pivot Points Daily Session
Pivot Point with base zone daily Asia-London-New york Session.
$ 15
/
$19
REDGREENZONEREVERSAL
Miamberke
5.0
(1)
Free
Indicator
Indices
RSI
Stocks
+5
REDGREENZONEREVERSAL
The Red & Green Zone Reversal Indicator detects overbought and oversold market conditions using Bollinger Bands and RSI.
Free
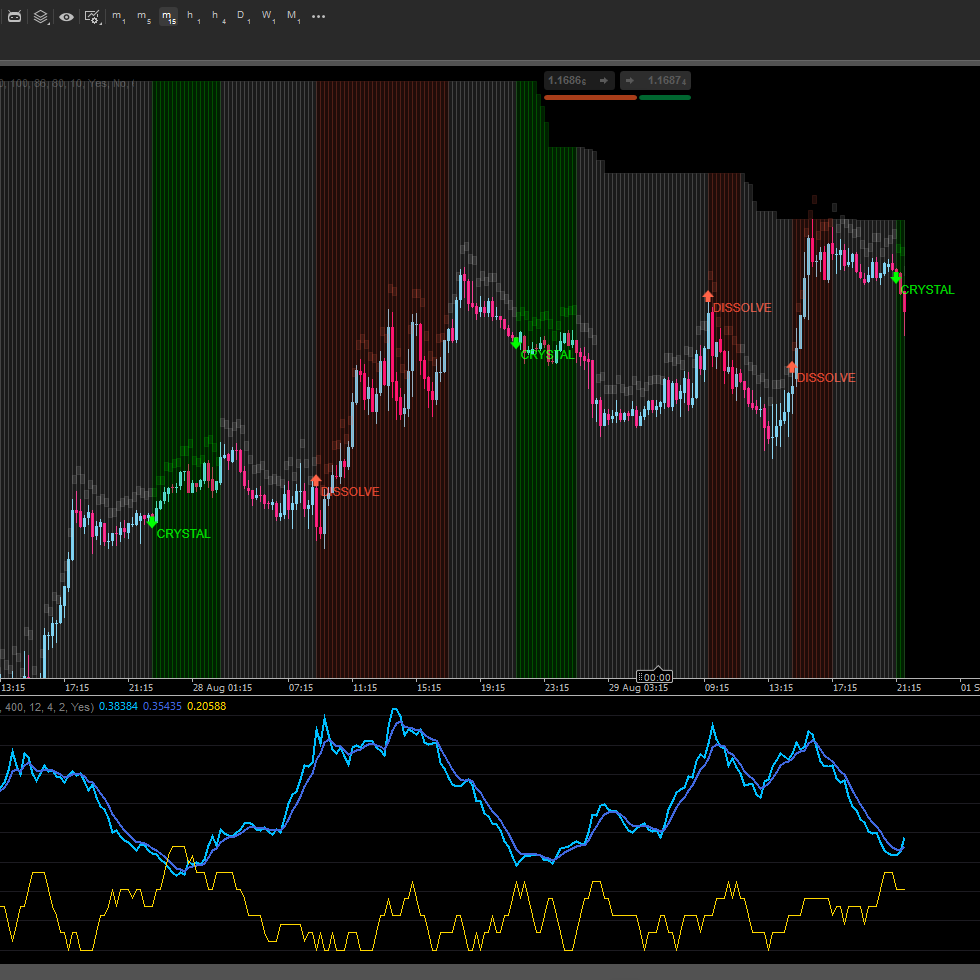
Market Entropy
st3llars33r
Free
Indicator
Market Entropy
Market entropy + DC. Spot crystallization/chaos shifts with an optional on-chart overlay.
Free
Load more

!["Tabajara corrigido[fix]" logo](https://market-prod-23f4d22-e289.s3.amazonaws.com/4ab3d8cf-fd62-449d-afce-1eb4626c4128_fix.png)

!["[Stellar Strategies] Market Session Ultimate" logo](https://market-prod-23f4d22-e289.s3.amazonaws.com/92b85b76-697c-4a8f-811f-ddd63eb8f9c8_cTrader_oSHtUgCtNJ.png)


.png)