Indicator
breakout
"PDHL" logo
PDHL
3.0
03/09/2025
1489
Desktop
"PDHL" uploaded image"PDHL" uploaded image"PDHL" uploaded image

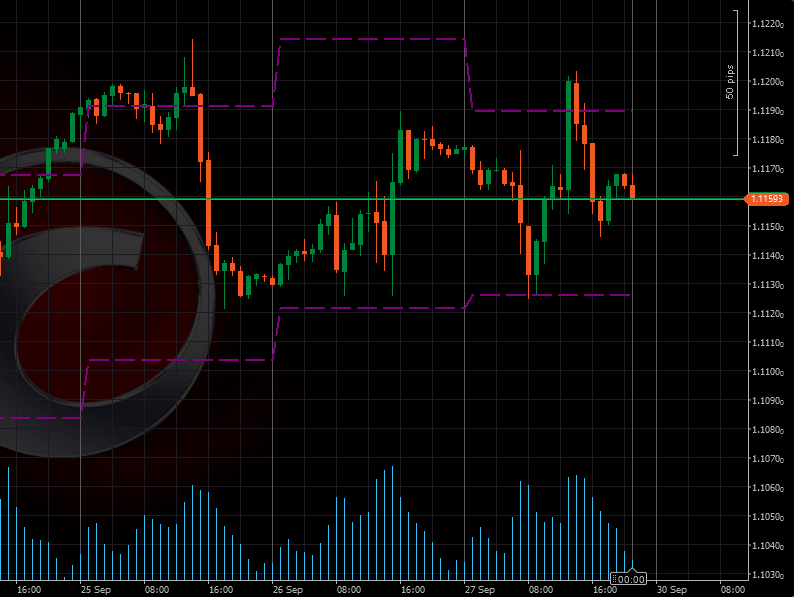
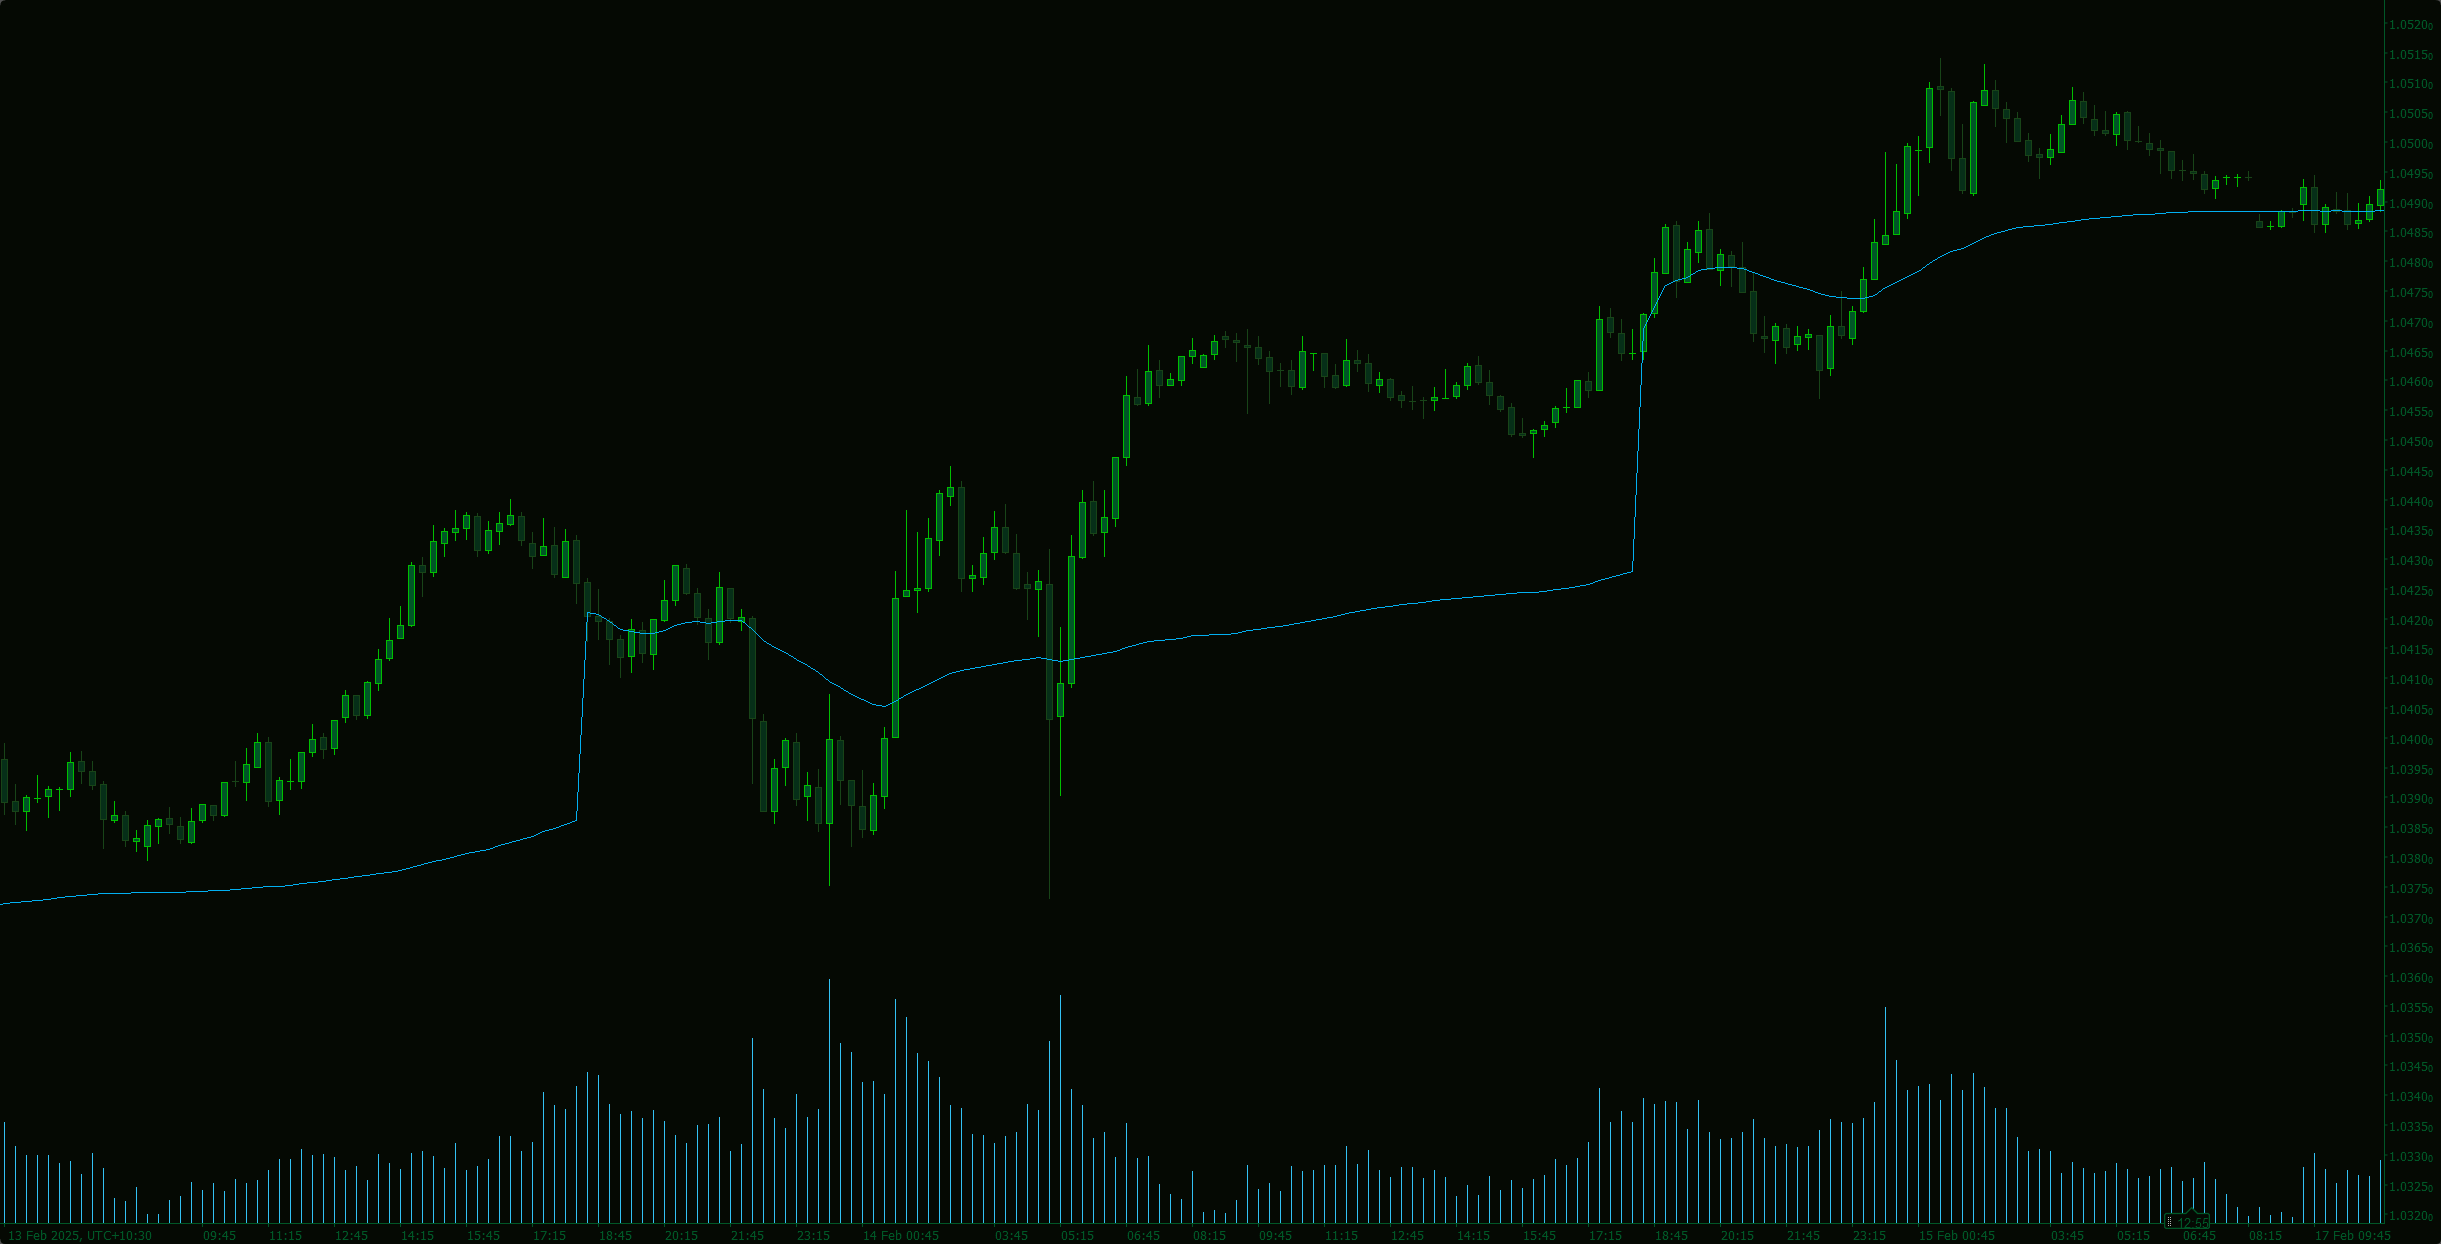
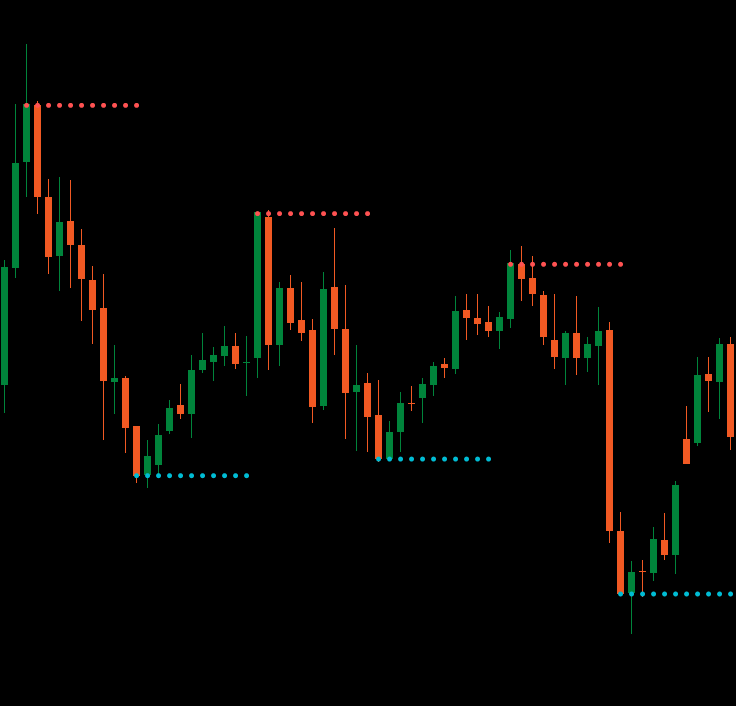
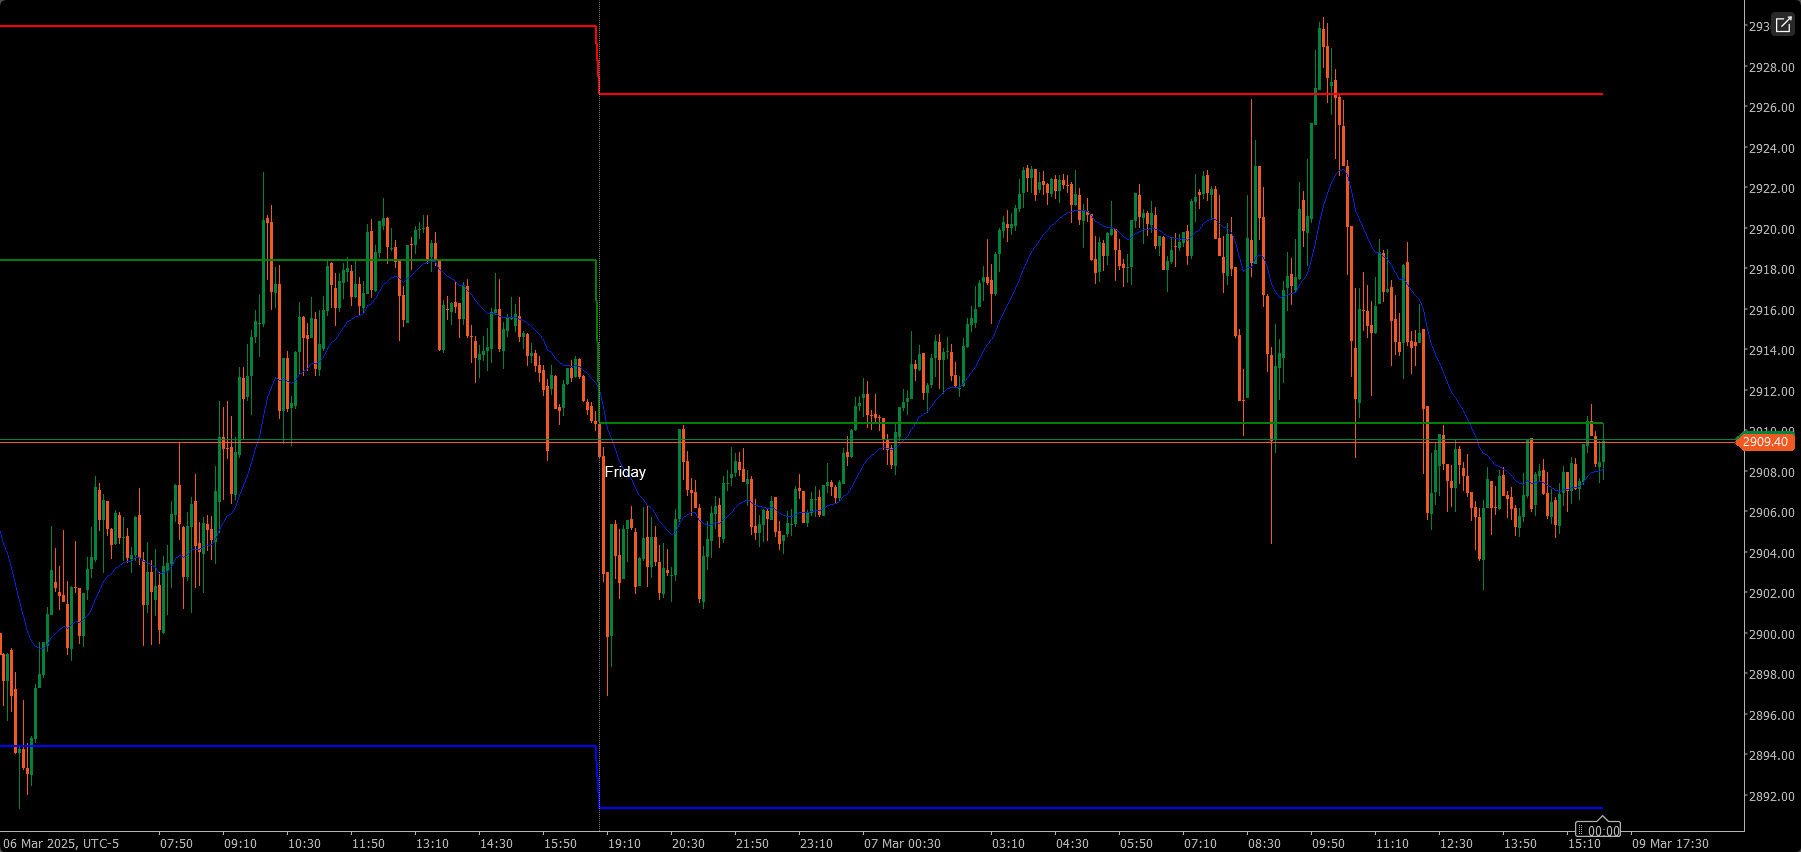
Introducing the High-Low Trading Indicator

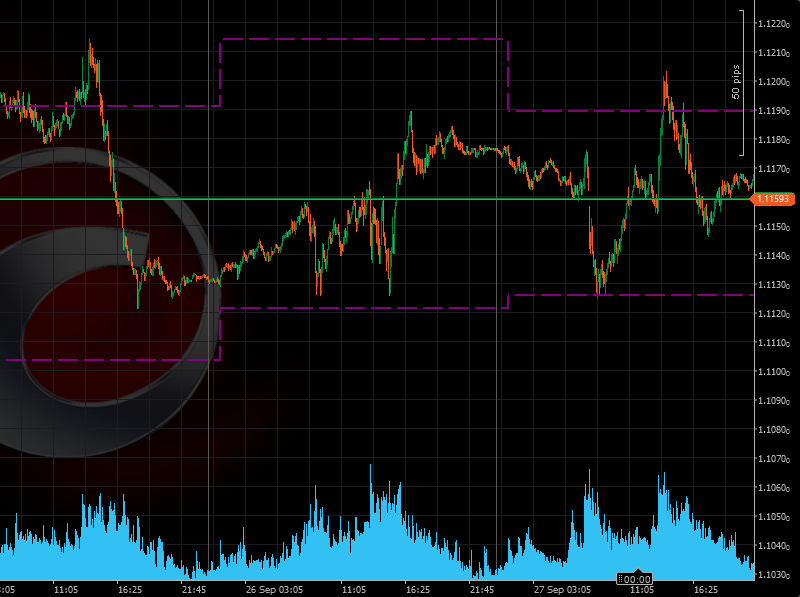
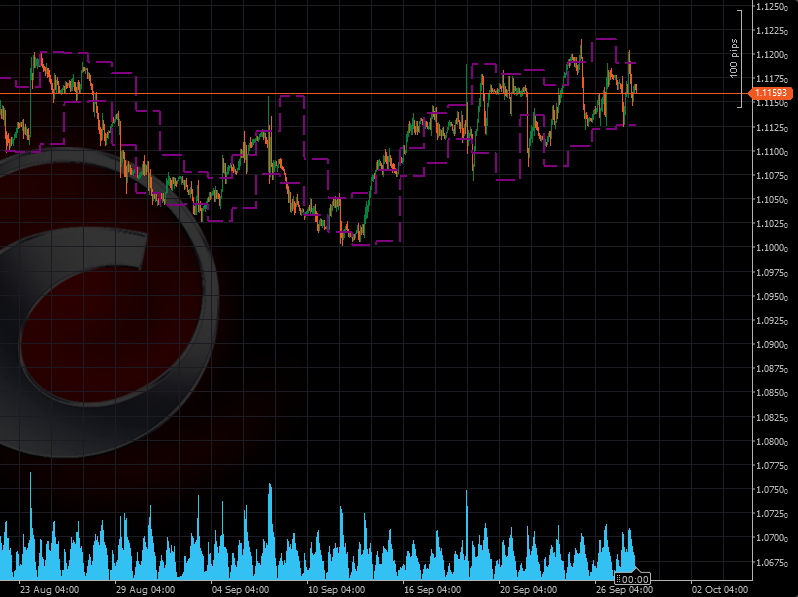
This indicator is designed to automatically plot the previous day's highest and lowest price levels on your chart. This tool helps you quickly identify key levels for potential breakouts and reversals.

Key Benefits:

  • Ideal for Breakout Trading: This indicator highlights critical price levels from the prior day, which are often used as reference points for breakout strategies. Trading breakouts above or below these levels can offer high-potential setups.
  • Simple Yet Effective: The High-Low Trading Indicator focuses on one of the most important aspects of price action – the previous day’s high and low. By incorporating these levels into your strategy, you gain a clearer sense of market structure and potential turning points.

Attentions:

  • Best used on timeframes less than 1 Day

Settings:

  • Include Sunday: default = no
More from this author
DataWindow
An MT-style Data Window for enhanced data visualization – hope this will be helpful!
ColorfulTickVolume
Change the color of Tick Volume based on the price movement
Top-rated
"STC" logo
5.0
(2)
STC
Schaff Trend Cycle (STC) Indicator
ColorfulTickVolumeV2
Changes the Tick Volume color based on price movement, synchronized with BullFillColor and BearFillColor in ColourOption
cTraderStore
Instant access to the cTrader Store for discovering cBots, indicators, and plugins.
You may also like
Period Separator
Period Separator that shows on all timeframes including renko and range bars.
Round Numbers
Automatically draws major, minor, and trace support/resistance levels at round numbers
DailyPivotPoints
Daily Pivot Points plots key support and resistance levels to guide precise trading decisions.
Renko 4k Pips
Custom your Renko Brick how do you wish!
SmartBot-Tenkan & ATR Indicator
The Tenkan-ATR Indicator is a powerful and innovative indicator for Traders. SALE OFF!!!
Indicator
breakout
btcusd
supertrend
+4
SmartTrend Support & Resistance Lines
🚀 Auto-detects support/resistance & trend channels! Saves time ⏳, spots key levels 🔍
DynamicVolumeSupplyDemand
Supply and Demand Zones
Indicator
breakout
indices
vwap
+4
ProVWAP
Advanced Anchored VWAP for cTrader: volatility bands, real‑time alerts & customizable session resets.
ADX and ADI
This custom indicator is a complete implementation of the Average Directional Index and Directional Indicators.
FAIR VALUE GAP INDICATOR
Pinpoint FVGs, track fills and see mitigation stats — trade imbalances with clarity and confidence.
Repiptor RSI Amplified
RSI Amplified
Indicator
forex
indices
rsi
+1
FiboTrend-Pro
😎Read the description before purchasing💩
Indicator
breakout
btcusd
supertrend
+4
ICT Power of 3
🎯 Auto-plots key zones (Accumulation, Manipulation, Distribution) . Reveals institutional traps & trends.
KAMA
Custom KAMA Indicator – Optimized for Speed and Precision
Market Sessions V2_NSC
Market Session V2: Full Control. colors, history, session/text toggles, font size. Elevate your strategy!
vpdi
VPDI (open, close, high and low with % of the previous day and price changes in % of the previous day's close)
Indicator
bollinger
RT Qualitative Quantity Estimation
Unlock trading precision with QQE! Dual QQE indicators with a Bollinger Bands zero line provide clear buy/sell signals.
rvwap v1
Rolling VWAP with dynamic or fixed time window, customizable source price and standard deviation bands.