HTFOverlayPlus
"HTFOverlayPlus" logo
03/09/2025
35
Desktop
Since 10/02/2025
Free installs
476

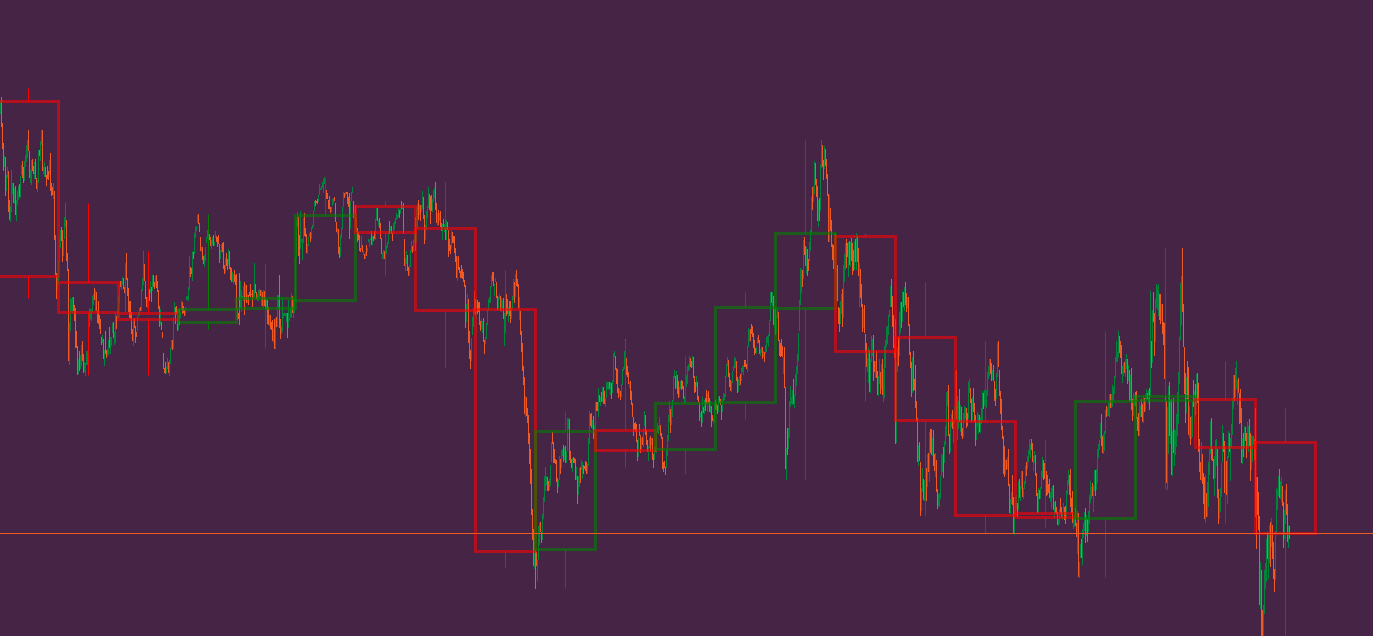
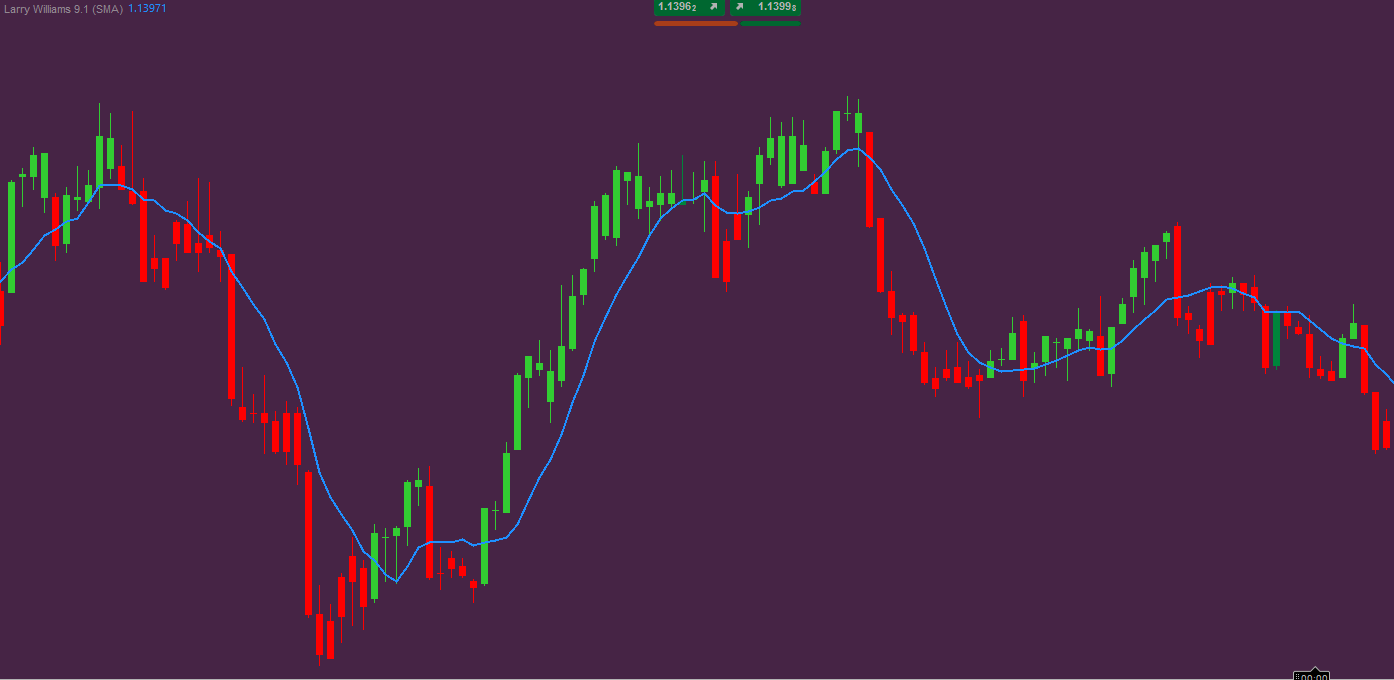
Este indicador sobrepõe candles de um time frame superior sobre o gráfico do time frame atual. Ele permite visualizar até 50 candles de um time frame maior e ajusta a cor das velas de acordo com a direção do preço (alta ou baixa). O indicador oferece a possibilidade de personalizar a espessura das bordas do corpo das velas e as cores para velas de alta e baixa. Ele é útil para traders que desejam visualizar a ação do preço em time frames superiores enquanto operam em time frames menores, permitindo uma análise mais precisa das tendências. (Obs: funciona com corpo invisível apenas no time frame e o resto apenas pinta.)


This indicator overlays candles from a higher time frame onto the current chart time frame. It allows you to display up to 50 candles from a larger time frame and adjusts the candle color based on price direction (bullish or bearish). The indicator provides the option to customize the body thickness and the colors for bullish and bearish candles. It is useful for traders who want to visualize higher time frame price action while trading on smaller time frames, enabling more accurate trend analysis. (Note: only works with invisible body in the time frame and the rest just paints.)


Este indicador superpone velas de un marco temporal superior en el gráfico del marco temporal actual. Permite mostrar hasta 50 velas de un marco temporal mayor y ajusta el color de las velas según la dirección del precio (alcista o bajista). El indicador ofrece la posibilidad de personalizar el grosor de los bordes del cuerpo de las velas y los colores para las velas alcistas y bajistas. Es útil para los traders que desean visualizar la acción del precio en marcos temporales superiores mientras operan en marcos temporales más pequeños, lo que permite un análisis más preciso de las tendencias. (Nota: solo funciona con cuerpo invisible en el marco temporal y el resto solo pinta.)

More from this author
VWAP Tabajara
VWAP Tabajara
Larry Williams 9.1
Larry Williams 9.1
HeatMap Candle
HeatMap Candle
Tabajara corrigido[fix]
corrigido todos os bugs e cores invertidas tabajara antigo deleetado
You may also like
ADVANCED ICT + ADR + AWR SUITE PRO
ADVANCED ICT + ADR + AWR SUITE PRO (The Ultimate All-in-One Toolkit for Price Action Traders)
TraderMaxBBflterXDemo-
TraderMax BB Filter X (DEMO) for cTrader 🧪 Limited-Time Demo Version (24h) TraderMax BB Filter X (DEMO) is a precision
Indicator
Signal
Scalping
Nadaraya-Watson Indicator
MM-Symbol Info (free)
Enhance the trading experience with real-time Spread, Time To Close, rPNL, uPNL, PNL and minimalistic Bid / Ask lines
Indicator
Grid
XAUUSD
Forex
+3
Daily Open Color Zones
indicator showing the Daily Open Line and instantly shading bullish and bearish zones.
Volume Weighted Average Price
VWAP is a powerful tool for intraday traders
EMA UP&DOWN 2025
SectorIndex Dual Moving Average Indicator: Your Market Compass 🧭
Rsi Scalp Indi
RSI Scalper delivers split‑second entries on volatile assets.
Indicator
Signal
Half Trend BT
Half Trend BT by BullittTraders
Indicator
NAS100
Indices
XAUUSD
+4
PrevDayProjection
Automatically calculates the previous day’s high and low, determines the range, and then projects Fibonacci levels.
Indicator
RSI
Breakout
XAUUSD
+5
Shielded Trend
Buy/Sell signals filtering noise, color-coded trends & strength shield 🛡️. Trade only with POWER ⚡
Indicator
Signal
MACD
TradingViewMACD
Enhance your trading strategy with our customizable TradingViewMACD indicator. Optimize and elevate your market analysis
FX Market Sessions
Easily visualise Forex sessions with start/end markers and high/low levels for Sydney, Tokyo, London, and New York.
Volume Profile Fixed Range
Professional Volume Profile Indicator - Shows volume distribution, POC, Value Areas & Buy/Sell pressure.
Indicator
Breakout
Pivot Points Daily Session
Pivot Point with base zone daily Asia-London-New york Session.
SmartArrows AI V2
High-Performance Renko Chart Indicator with Advanced AI Filtering.
Indicator
RSI
Breakout
XAUUSD
+5
Dynamic Range MomentumI
This histogram helps visualize the strength and direction of market movements, making it easier to spot potential trends
Indicator
NAS100
NZDUSD
XAUUSD
+13
RT MACD Histogram
Enhance MACD Histogram! Visualize bull and bear price changes with vibrant colors for clearer, more insightful trading.