Polynomial Price Projection Channel
지표
버전 1.0, Feb 2026
Windows, Mac
4.0
리뷰: 1
📊 다항식 가격 예측 채널
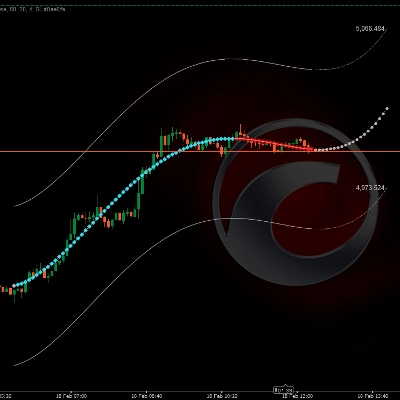
https://chartshots.spotware.com/c/699603101593d
🔎 이것은 무엇을 하나요?
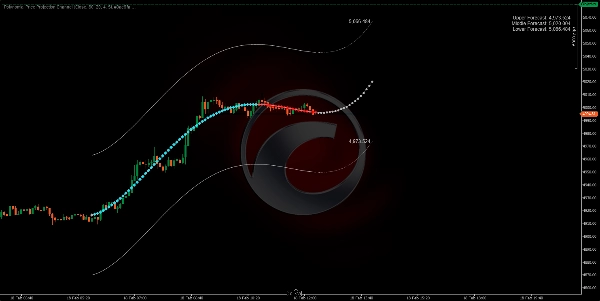
https://chartshots.spotware.com/c/69960348da652
마지막 N개의 가격 종가에 대해 수학적 곡선을 맞추고 미래로 확장하여 예측을 만듭니다. 그 곡선 주위에 최근 시장 변동성에 자동으로 적응하는 상단 및 하단 채널을 그립니다.
⚙️ 논리는 어떻게 작동하나요?
- 마지막 N개의 캔들(과거 바)을 가져와서 최소제곱법을 사용해 해당 가격에 가장 잘 맞는 다항식 곡선을 계산합니다.
- 곡선을 앞으로 확장합니다 (예측 바) 현재 추세의 수학적 예측으로서.
- 곡선을 위아래로 이동시켜 채널을 만듭니다 분석 기간의 최대 캔들 범위× 2를 사용하여.
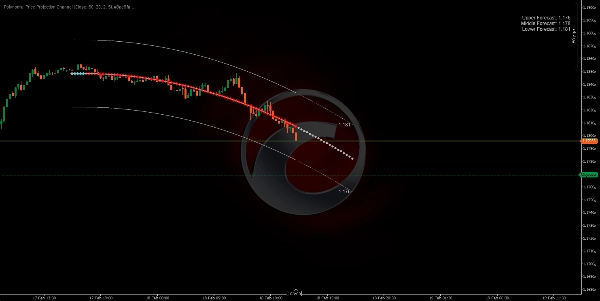
https://chartshots.spotware.com/c/6996039a07e3a
🛠️ 주요 매개변수
매개변수
기본값
목적
과거 바
80
분석하는 과거 캔들 수
예측 바
20
앞으로 예측하는 캔들 수
다항식 차수
4
곡선 유연성 (높을수록 곡선이 더 많음)
데이터 입력
종가
계산의 기준 가격
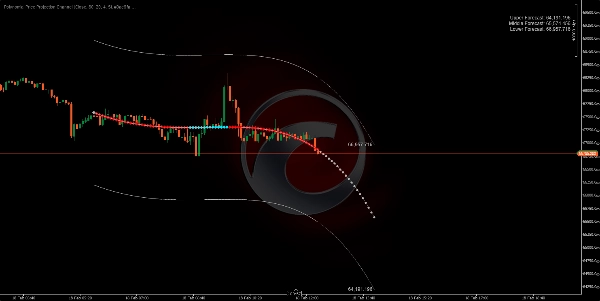
🎯 사용 방법
🟢 매수 가능성 → 가격이 하단 밴드에 닿고 예측이 상승 방향일 때.
🔴 매도 가능성 → 가격이 상단 밴드에 닿고 예측이 하락 방향일 때.
⚠️ 항상 다른 요소들과 함께 확인하세요. 이 지표는 수학적 외삽법이며 보장된 예측이 아닙니다.
지표 프로필
4.0
리뷰: 1
5 | 0 % | |
4 | 100 % | |
3 | 0 % | |
2 | 0 % | |
1 | 0 % |
고객 리뷰
February 20, 2026
The reason it feels usable is it gives context without making the decision, and M15 is enough for the first pass.
BTCUSD
Forex
Signal
Indices
EURUSD
Commodities
GBPUSD
NZDUSD
Bollinger
Prop
Crypto
Stocks
AI
XAUUSD
NAS100
ATR
USDJPY
트레이딩 봇, 지표, 플러그인 등 cTrader Store에서 제공되는 상품은 제3자 개발자에 의해 제공되며, 이는 단순히 정보 및 기술적 접근을 목적으로 제공된 것입니다. cTrader Store는 중개인이 아니며, 투자 조언, 개인별 추천 또는 향후 성과에 대한 어떠한 보장도 제공하지 않습니다.


가입일 03/10/2024
161
판매
37.66K
무료 설치