
ATR advanced
Gösterge
Sürüm 1.0, Apr 2026
Windows, Mac
4.3
Değerlendirmeler: 3

32
Satışlar
992
Ücretsiz yüklemeler
Açıklama
ATR Gelişmiş Volatilite ve Trend Sistemi
Standart Ortalama Gerçek Aralık (ATR), piyasa volatilitesini ölçmek için harika bir araçtır, ancak varsayılan haliyle sadece tek bir, okunması zor çizgidir. Volatilitenin yüksek mi düşük mü olduğunu söyler, ancak nasıl işlem yapılacağını söylemez.
ATR Gelişmiş bu temel metriği tam bir görsel işlem sistemine dönüştürür. Volatilite Sinyal Çizgisi, Yönlü Boya Çubukları ve Momentum Histogramı ekleyerek, piyasanın ne zaman hareket ettiğini değil, mevcut trendin arkasında tam olarak ne kadar güç olduğunu da size bildirir.
TAM SÜRÜMÜN Ana Özellikleri:
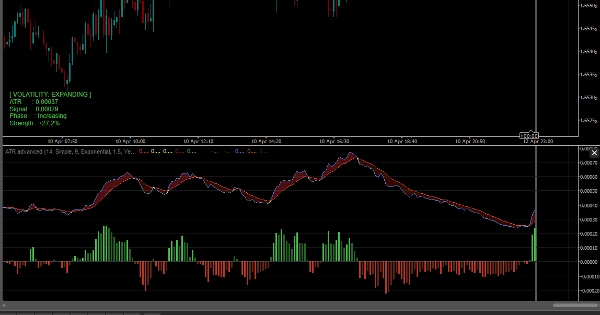
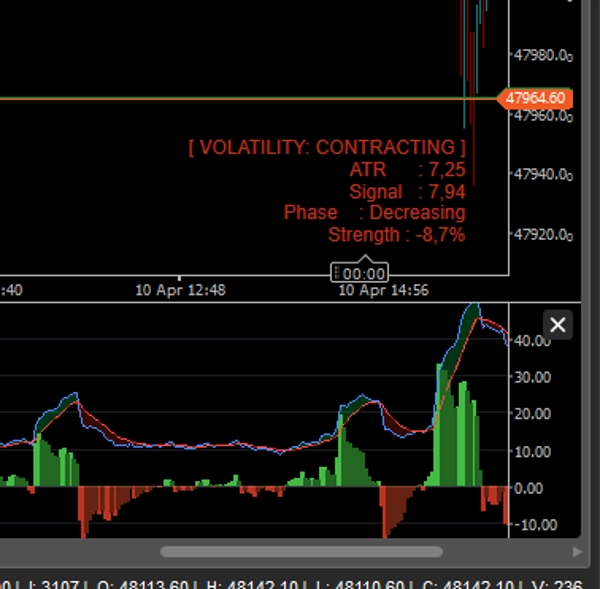
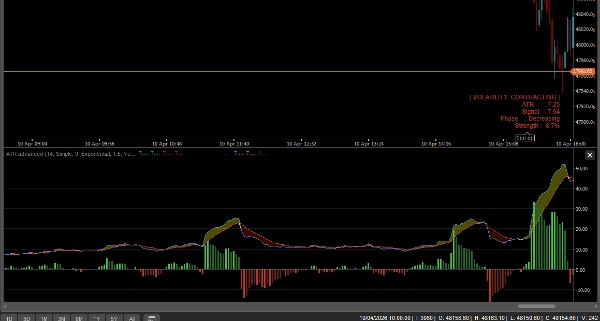
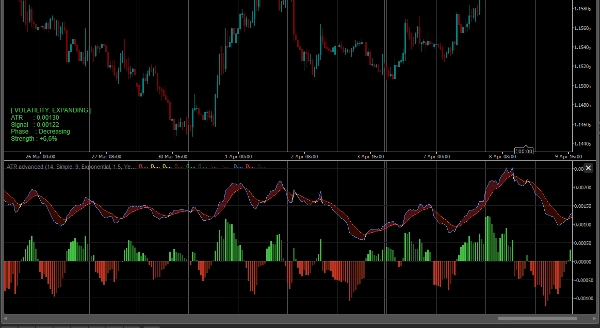
- Volatilite Genişleme Bulutları: ATR'ye bir Hareketli Ortalama (Sinyal Çizgisi) ekledik. ATR ile Sinyal Çizgisi arasındaki alan dinamik bir Bulut ile doldurulur.
-
- Yeşil Bulut (Genişleyen): Volatilite artıyor. Piyasa uyanıyor ve trendler güçlü.
- Kırmızı Bulut (Daralan): Volatilite azalıyor. Piyasa konsolide oluyor veya yatay seyrediyor.
- Momentum Histogramı: Alt kısımda özel bir histogram, ATR ile Sinyal Çizgisi arasındaki tam farkı takip eder ve volatilite kırılmalarını tam olarak gerçekleşmeden önce fark etmenize yardımcı olur.
- Akıllı Çubuk Renklendirme (Yön + Volatilite): Bu en önemli özelliktir. Gösterge hem fiyat yönünü (Boğa/Ayı) HEM de volatilite durumunu okur ve mumlarınızı buna göre boyar:
-
- Parlak Yeşil/Kırmızı: Güçlü Trend + Genişleyen Volatilite (Kırılma ve trend işlemleri için mükemmel).
- Koyu Yeşil/Kırmızı: Zayıf Trend + Daralan Volatilite (Uyarı: Momentum azalıyor).
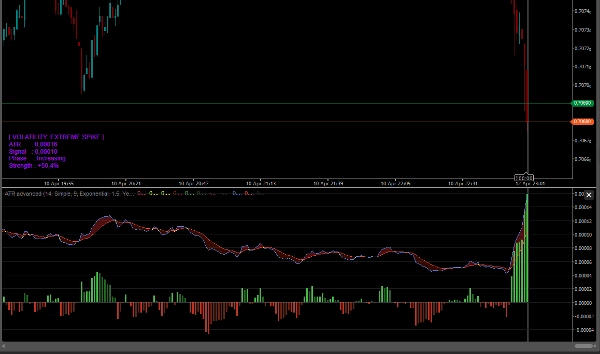
- Aşırı Volatilite Tespiti: ATR anormal şekilde yükseldiğinde (örneğin, büyük haber olayları veya ani tepe noktalarında), mumlar Mor (Aşırı) olur ve potansiyel bir doruk ya da büyük kırılma konusunda sizi uyarır.
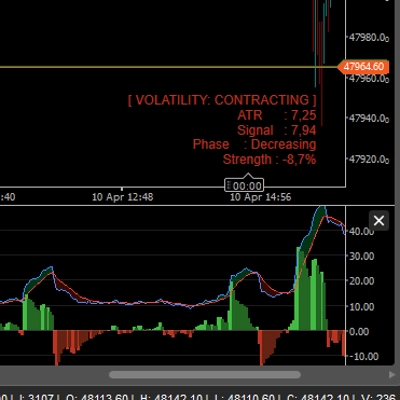
- Gerçek Zamanlı Bilgi Paneli: Şık bir grafik üstü panel, tam ATR değerini, Volatilite Fazını (Genişleyen/Daralan) ve yüzde güç okumalarını gösterir.
- Tamamen Açık: Herhangi bir sembolde (Forex, Kripto, Endeksler, Hisseler) ve herhangi bir zaman diliminde sınırsız işlem yapabilirsiniz. Ömür boyu erişim.
Nasıl işlem yapılır?
- Kırılma: Volatilite Bulutu Kırmızı (Daralan) olduğunda işlem yapmaktan kaçının. ATR'nin Sinyal Çizgisini yukarı kesmesini (Bulutun Yeşile dönmesini) ve mumlarınızın Parlak Yeşil veya Parlak Kırmızı olmasını bekleyin. Bu, gerçek ve yüksek olasılıklı bir kırılmayı doğrular.
- Takip Eden Stoplar: Volatilite Bulutu Yeşil kaldığı sürece kazanan işlemlerde kalın. Bulut aşağı kesip Kırmızıya döndüğünde, momentumun tükendiği anlamına gelir—kar almanın tam zamanı.
- Doruk Uyarısı: Bir trend içindeyseniz ve mumlar aniden Mor olursa, dikkatli olun! Bu, genellikle bir trendin sonunda ve keskin bir dönüşten hemen önce gerçekleşen aşırı volatilite sıçramasını temsil eder.
Özet
YZ özeti
ATR Advanced is a volatility and trend indicator that enhances the standard Average True Range (ATR) by providing a comprehensive visual trading system. It integrates a Volatility Signal Line (a moving average of ATR) and fills the area between ATR and this line with dynamic Volatility Expansion Clouds. Green clouds indicate expanding volatility and strong trends, while red clouds signal contracting volatility and market consolidation.
Key features include a Momentum Histogram that tracks the difference between ATR and its Signal Line to identify volatility breakouts early, and smart bar coloring that reflects both price direction and volatility state. Bright green/red bars denote strong trends with expanding volatility, dark green/red bars indicate weak trends with contracting volatility, and purple bars warn of extreme volatility spikes often associated with trend climaxes or major events.
The indicator also includes a real-time on-chart dashboard displaying ATR values, volatility phases, and strength percentages. It supports all symbols—including Forex, cryptocurrencies, indices, and stocks—and any timeframe without limitations.
Traders can use it to confirm breakouts when volatility clouds turn green and bars brighten, manage trailing stops by monitoring volatility contraction, and receive warnings of potential trend reversals during extreme volatility spikes.
Key features include a Momentum Histogram that tracks the difference between ATR and its Signal Line to identify volatility breakouts early, and smart bar coloring that reflects both price direction and volatility state. Bright green/red bars denote strong trends with expanding volatility, dark green/red bars indicate weak trends with contracting volatility, and purple bars warn of extreme volatility spikes often associated with trend climaxes or major events.
The indicator also includes a real-time on-chart dashboard displaying ATR values, volatility phases, and strength percentages. It supports all symbols—including Forex, cryptocurrencies, indices, and stocks—and any timeframe without limitations.
Traders can use it to confirm breakouts when volatility clouds turn green and bars brighten, manage trailing stops by monitoring volatility contraction, and receive warnings of potential trend reversals during extreme volatility spikes.
Gösterge profili
Gösterge kategorisi
Momentum
Çıktı türü
Görselleştirme
Sinyaller
Filtre
Veri gereklilikleri
Yalnızca çubuklar
Desteklenen sinyaller
Trend gücü
Volatilite
Tartışma
Müşteri değerlendirmeleri
4.3
Değerlendirmeler: 3
5 | 33 % | |
4 | 67 % | |
3 | 0 % | |
2 | 0 % | |
1 | 0 % |
Müşteri değerlendirmeleri
April 24, 2026
20 signals gives enough for a first read, and the signal gets compared with context.
April 18, 2026
3 percent DD is the line to watch, and the log becomes easier to read.
SSS
ATR
Moving Average
cTrader Store üzerinden erişilebilen işlem botları, göstergeler ve eklentiler gibi ürünler, üçüncü taraf sağlayıcılar tarafından sağlanır ve yalnızca bilgilendirme ve teknik erişim amaçlarıyla sunulur. cTrader Store bir broker değildir ve yatırım tavsiyesi, kişisel öneriler vermez veya gelecekteki performansı garanti etmez.






























Fiyat
32
Satışlar
992
Ücretsiz yüklemeler