Description
A candle shows you the outcome. It doesn't show you who did the work.
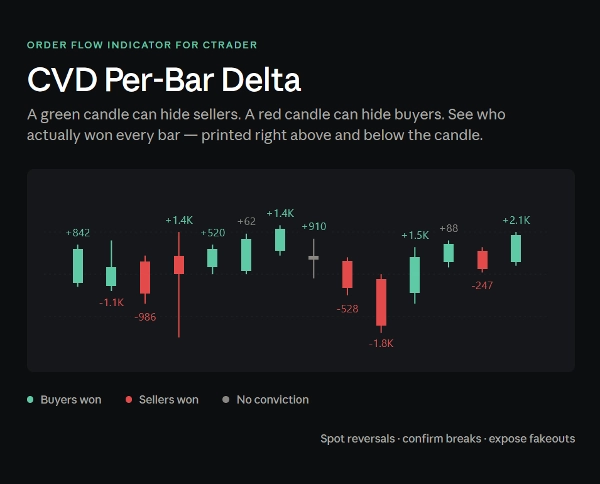
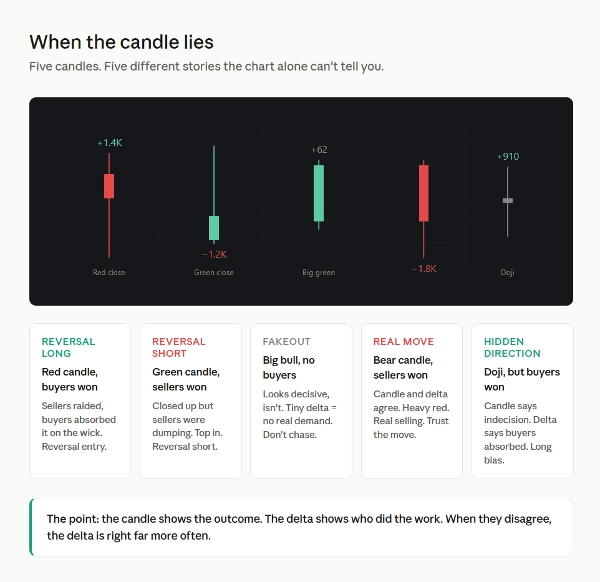
A bullish candle can close green while sellers were dumping into the rally. A bearish candle can close red while buyers absorbed every seller in the bar. A doji can hide a +900 delta of one-sided pressure. Price action alone can't tell you. Volume alone can't tell you. You need to know who won.
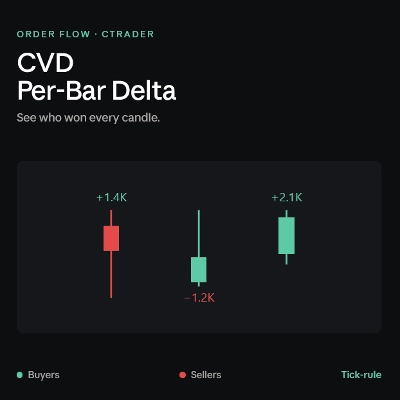
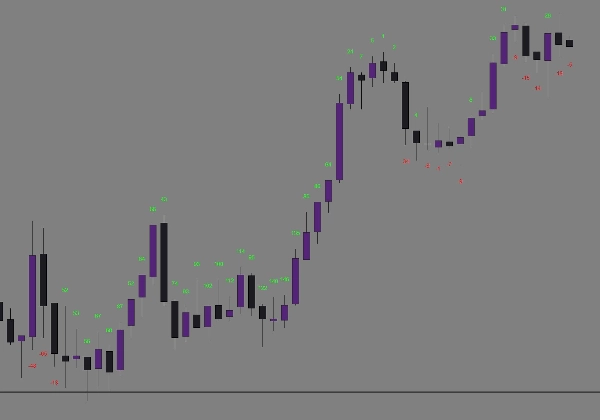
CVD Per-Bar Delta uses tick-rule classification on real cTrader tick data to count buyers vs sellers inside every candle, then prints the result directly on your chart as a colour-coded number. One glance and you know whether bulls or bears were in control — and by how much.
What you see:
- A green number above buyer-dominated bars
- A red number below seller-dominated bars
- Number size scales with conviction — small numbers mean a fair fight, big numbers mean one side dominated
Where it earns its place:
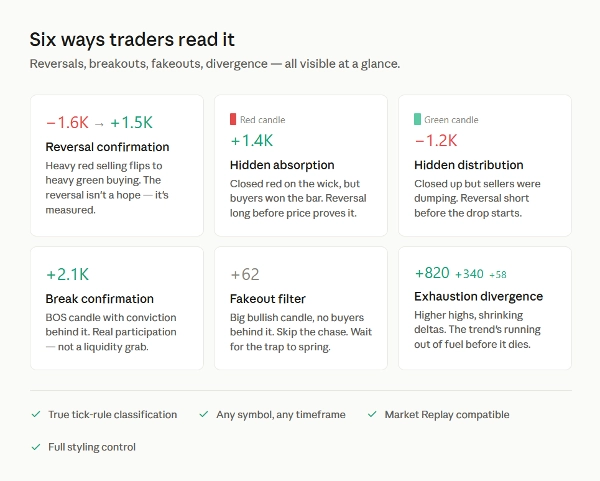
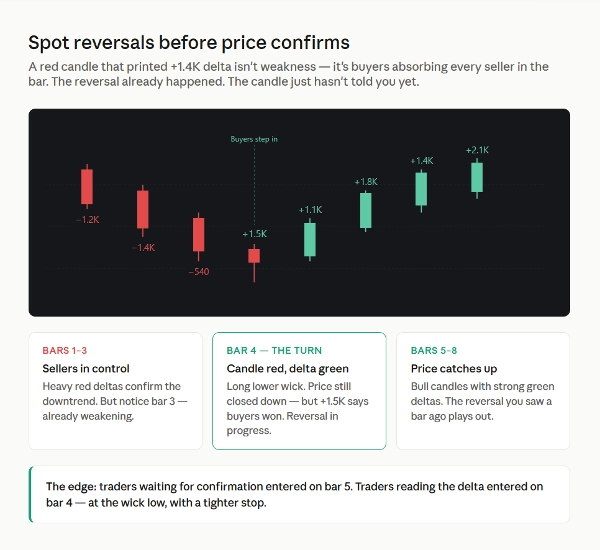
Reversal confirmation. A red candle that printed +1.4K delta isn't weakness — it's buyers absorbing every seller in the bar. The reversal already happened. The candle just hasn't told you yet. Enter at the wick low with a tight stop, while everyone else waits for the next candle to confirm.
Hidden absorption (long setups). Price spikes down into your support zone or order block. Long lower wick. Big green number. Buyers swallowed the raid. That's a high-probability reversal long — and the delta saw it before the candle closed.
Hidden distribution (short setups). Price grinds higher into resistance. Each green candle prints smaller delta than the last, then a green candle closes with a red delta. Buyers exhausted, sellers dumping into the rally. Top in. Short.
Break confirmation. A BOS candle with a strong delta in the break direction is real participation. Same break with a weak or opposite-coloured delta is a liquidity grab dressed as a breakout. Filter the fakeouts before you take them.
Exhaustion divergence. Price keeps making higher highs but the green deltas are getting smaller with each push. Buyers are running out of ammunition. The trend is dying before it dies.
Conviction filter. Two candles look identical on the chart. One has +850 delta. The other has +40. They are not the same candle. Skip the noise. Take the conviction bars.
Built for serious traders:
- True tick-rule classification using cTrader's tick data — not synthetic OHLC approximation
- Works on any symbol, any timeframe, any chart
- Compatible with Market Replay for back-testing your read
- Last 50 bars by default, fully configurable — zero clutter
Full styling control:
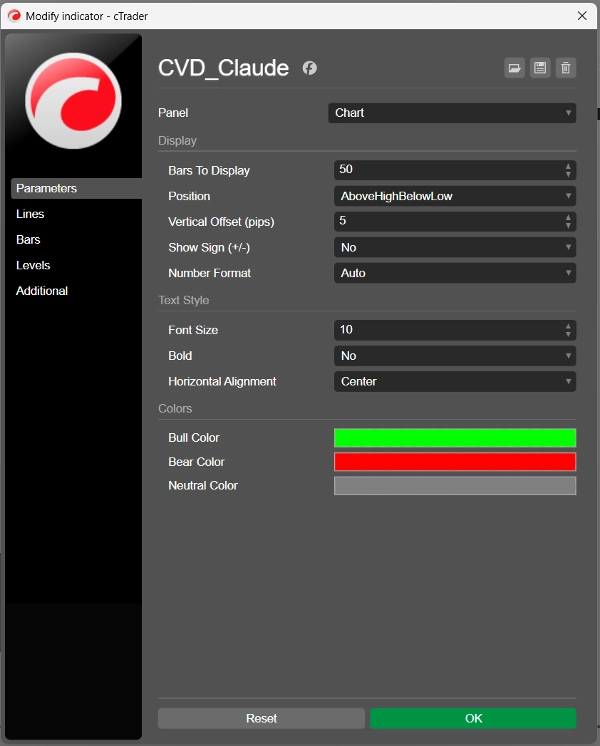
- Position — above bar, below bar, or smart (above highs for bull bars, below lows for bear bars)
- Text — font size 6 to 30, optional bold, alignment options
- Colours — bull, bear and neutral pickers, match any chart theme
- Format — raw numbers, K-thousands, or auto-switching
- Display — adjustable pip offset, sign toggle, bar count
Important: This indicator requires tick data. Live charts use it automatically. For Market Replay, select "Tick data" when starting your replay session.
Pairs especially well with: order block / SMC strategies, reversal trading at key levels, breakout systems, mean-reversion setups, and any methodology that benefits from confirming intent behind a candle.
The chart shows you what happened. The delta shows you why.
Summary
Key features include:
- Identification of hidden absorption and distribution within bars, aiding in reversal and breakout confirmations.
- Detection of exhaustion divergences where price action and delta diverge, signaling weakening trends.
- Conviction filtering to distinguish between bars with strong versus weak participation.
- Compatibility with any symbol, timeframe, and chart, including Market Replay mode for backtesting.
- Full customization of display position, font, colors, and number formatting.
This indicator requires tick data and is intended for traders who incorporate volume and order flow analysis to confirm market intent behind price movements. It pairs well with order block, smart money concepts, breakout, reversal, and mean-reversion strategies.