설명
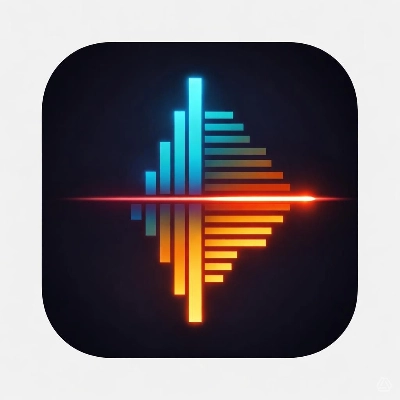
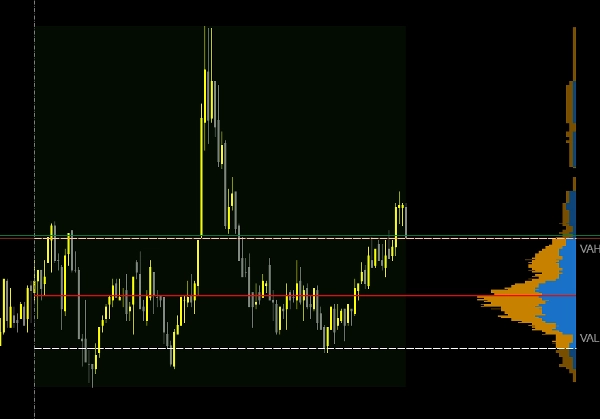
Overview The Anchored Volume Profile (AVP) is an advanced, highly interactive analytical tool designed for cTrader. Instead of relying solely on price action, this indicator reveals the exact price levels where the most trading activity occurred during a specific market swing. By analyzing tick volume, it provides a precise "x-ray" of the market, helping you identify true support and resistance, equilibrium zones, and Smart Money footprints.
How It Works This indicator is fully interactive. You do not need to struggle with complex input dates. Simply hold the Shift key and Left-Click on any candle on your chart. The indicator will instantly anchor to that specific point in time and calculate the volume profile from that candle up to the current, live price.
Key Features & What It Shows
- Point of Control (POC): Clearly highlights the exact price level with the highest volume concentration (the ultimate magnet for price).
- Value Area (VA): Visually distinguishes the price range where a specified percentage of total volume (e.g., 70%) was traded, including dynamic Value Area High (VAH) and Value Area Low (VAL) lines with text labels.
- Buy/Sell Volume Split: Each volume row is split into two colors (Up Volume / Down Volume), giving you a clear estimation of buying versus selling pressure at every price level.
- Clean Chart Design (Offset Feature): Unlike basic volume tools that clutter your candles, this profile is completely pushed into the future (offset to the right by a fixed distance). This guarantees that your live price action remains 100% visible and unobstructed.
- Background Highlight: A subtle, customizable background box highlights the exact timeframe and price range currently being analyzed.
Core Strengths
- Dynamic & Fast: Recalculates instantly upon
Shift + Clickwithout reloading the chart or slowing down the platform. - SMC & Price Action Friendly: Perfect for traders using Smart Money Concepts, looking for order blocks, hidden liquidity pools, or confirmation for Fair Value Gaps (FVG).
- Robust Rendering Engine: Custom-built to prevent visual glitches. The indicator will never delete your manually drawn trendlines or Fibonacci levels.
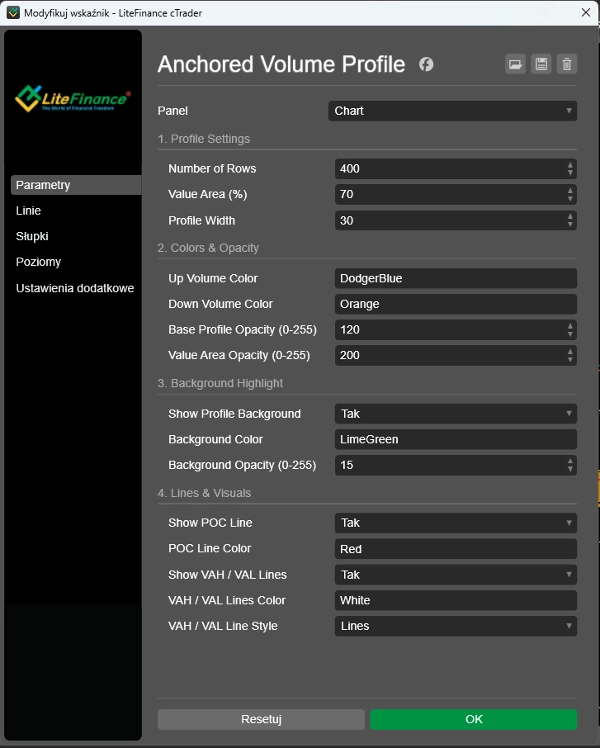
Settings & Customization The indicator comes with a clean, fully organized settings menu without confusing decimal numbers:
- Profile Settings: Adjust the Number of Rows (resolution), Value Area percentage, and the physical width of the profile bars.
- Colors & Opacity: Full control over Up/Down volume colors, Base Opacity, and Value Area Opacity for a perfect blend with your chart theme (dark or light).
- Background Highlight: Toggle the background box on/off and adjust its tint and transparency.
- Lines & Visuals: Easily toggle the POC, VAH, and VAL lines, change their colors, and select your preferred line style (Solid, Dashed, Dotted, etc.).
Perfect For: Intraday Traders, Swing Traders, and anyone looking to incorporate Order Flow mechanics into their technical analysis.