present
注册即可在首次购物时获得 $50 优惠
Trading product for SmartMoneyMap 指标 Key Levels BOS, image 1
SmartMoneyMap
指标
版本 1.0, Jul 2026
Windows 版、Mac 版
Trading product for SmartMoneyMap 指标 Key Levels BOS, image 2
注册日期 05/01/2025
15
销售

说明

===============================================================================

智能资金地图

===============================================================================


一个用于cTrader的智能资金概念(SMC)指标。它将市场

结构及相关的机构交易概念投射到图表上的单一、

易于阅读的层上——无需任何ZigZag或其他辅助

指标,完全基于价格数据计算。


-------------------------------------------------------------------------------

[ 它绘制的内容 ]

-------------------------------------------------------------------------------


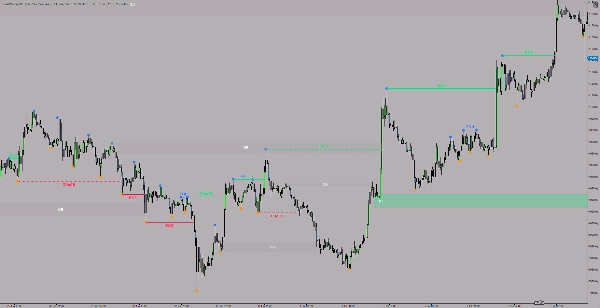
* 市场结构(BOS / CHoCH)

一个基于方向的摆动模型跟踪结构,在每次方向变化时冻结一个确认的

摆动点,并在封闭蜡烛穿过相关参考水平时标记结构突破(BOS)

和特征变化(CHoCH)事件。


* 摆动点

标记确认的局部高点和低点。


* 等高/等低(EQH / EQL)

突出显示相同高度的高点/低点,通常作为流动性区域。 “等价”容差

来源于最近的平均K线范围(高点-低点),而非外部ATR。


* 订单区块(OB)

仅源自CHoCH并由FVG(公平价值缺口)确认的订单区块区域。该区域

在更细的时间框架上被细化,完整生命周期被跟踪:活跃 -> 缓解(触及) -> 破坏。


-------------------------------------------------------------------------------

[ 主要优势 ]

-------------------------------------------------------------------------------


(+) 不重绘

它只处理封闭的蜡烛;当前形成的蜡烛永远不会创建摆动或事件。一旦绘制,内容保持不变。


(+) 无外部依赖

所有计算均来自原生价格数据——无ZigZag,无ATR,无其他加载的指标。


(+) 多时间框架

结构可以在图表时间框架或单独选择的时间框架上计算,而标记精确贴合显示图表的蜡烛(正确处理周末/交易时段缺口)。订单区块可以使用专用的细化时间框架进行细化。


(+) 开发者接口

它公开了一个公共查询API(趋势、摆动、结构事件、订单区块),以便cBots和其他指标可以直接使用其输出。


(+) 性能限制

可调节的摆动、事件、EQH/EQL和订单区块标记数量上限,保持图表清晰且运行快速。


-------------------------------------------------------------------------------

[ 自定义 ]

-------------------------------------------------------------------------------


- 显示:每个层(摆动、BOS、CHoCH、标签、EQH/EQL、订单区块)可独立切换;线条粗细和标签字体大小可调节。


- 颜色:摆动高/低点、多头/空头结构、EQH/EQL,以及多头/空头加缓解的订单区块区域分别使用不同颜色(带透明度)。


- EQH/EQL:回溯窗口(K线数)和灵敏度(作为平均K线范围的倍数)。


- 订单区块:细化时间框架、最大冲击腿长度、细化回溯深度。


- 时间框架:使用图表时间框架,或选择单独的结构时间框架。


-------------------------------------------------------------------------------

[ 使用方法 ]

-------------------------------------------------------------------------------


1. 将指标拖放到图表上。

2. 选择它是在图表时间框架上计算还是在专用结构时间框架上计算(时间框架组)。

3. 启用所需的SMC层(显示组)。

4. 根据所选工具和时间框架调整EQH/EQL灵敏度和订单区块设置。


注意:该指标作为价格图表的叠加运行,无需访问权限(AccessRights = None)。


-------------------------------------------------------------------------------

[ 适用对象 ]

-------------------------------------------------------------------------------


关注智能资金/ICT理念的交易者,想要通过单一、一致且不重绘的工具

审视市场结构、流动性水平和订单区块——无论是手动分析还是基于cBot的自动化。


===============================================================================

摘要

指标配置

讨论

客户评价

0.0
评价:0
客户评价
该产品尚无评价。已经试过了?抢先告诉其他人!

常见问答

Key Levels
BOS
Order Block
CHOCH
Market Structure
cTrader Store 提供的所有产品,包括交易机器人、指标和插件,均由第三方开发者提供,仅供信息参考和技术访问之用。cTrader Store 并非经纪商,不提供投资建议、个人推荐或任何未来业绩保证。

该作者的其他作品

指标
Prop
Forex
+2
Vision - Advanced Session Indicator
指标
Displays the previous day's, last week's, and last month's highest and lowest price levels on your chart.
指标
SMC
Prop
+14
FVG Multi Time Frame Indicator
指标
Prop
Forex
+4
It draws Pivot Levels on the chart.
"SCOB" 标识
评分最高
4.4
(5)
$19
/
$20
指标
SMC
Prop
+12
SCOB - Single Candle Order Block Indicator
指标
Prop
Forex
+13
Supertrend - Multi-Timeframe Indicator
cBot
SMC
Prop
+8
Bingo - Professional Position Manager

猜您喜欢

指标
Customize your Moving Average! Choose any timeframe and price source for precision and flexibility in your analysis.
指标
ATR
EMA
+5
Candle timer with live profit tracking on chart – displays pips, currency value, and percentage in real time.
指标
RSI
Breakout
+1
"Identify key market zones and visualize support/resistance from multiple timeframes on a single chart.
指标
Imbalance
Key Levels
+4
This indicator combines Multi-Timeframe Liquidity tracking, a dynamic Fair Value Gap (FVG) and a 50% Daily Range
指标
ATR
Wedge
+2
Strong Supertrend Turn Market Movement into a Clear Map Market analysis
指标
Fibonacci
Key Levels
+1
Explore Elliott wave counts, three swing sizes and example levels with an interactive cTrader chart panel.
指标
SMC
Forex
+5
Detects Break of Structure (BOS) and Change of Character (CHOCH)
指标
ATR
Forex
+6
It combines swing (pivot-based) market structure detection with Gann Fan geometry and Fibonacci retracement/extension
指标
Signal
Fractal Arrow Buy and Sell Indicator
指标
ATR
SMC
+21
MA Quant Adaptive Price Zone Oscillator identifie dynamiquement les zones de prix optimales pour les entrées et sorties.
指标
Prop
Forex
+11
🌊 See when the market is truly in play. Tsunami measures Relative Volume by time-of-day 🌊
"Vwap Bands" 标识
评分最高
4.5
(4)
$19
/
$29
指标
VWAP
Moving Average
Vwap Bands it is highly sought after by professional traders because it includes Standard Deviation Bands
指标
AI
ATR
+27
Smart Money Gaps: MTF FVG auto-detection, extension, and mitigation marker. Trade institutional imbalances.
指标
ZigZag
Indices
+2
Auto Trendlines, Fibonacci, Pitchfork and Patterns from non‑repainting pivots. One‑click Presets, targeted Alerts, and a
指标
Volume
Support & Resistance
Compare up to 27 symbols across eight timeframes with seven analysis engines and an interactive cTrader dashboard.
指标
BOS
CHOCH
+4
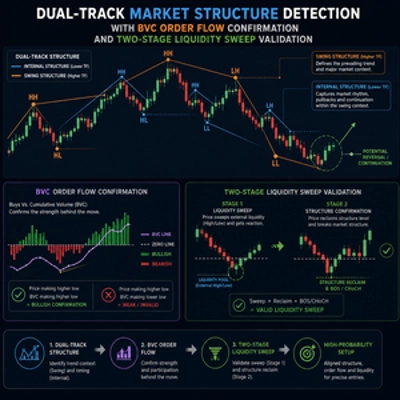
Dual-track market structure detection with BVC order flow confirmation and two-stage liquidity sweep validation.
"crossover 1" 标识
评分最高
4.2
(5)
$19
/
$29
指标
AI
Grid
+10
Crossover Buy and Sell Alerts and signals
指标
VWAP
Support & Resistance
Trading.FC$_vwap Algo shows VWAP trends, dynamic support/resistance and deviation bands to spot potential trade entries.

价格

注册日期 05/01/2025
15
销售