present
Regístrese y obtenga 50 $ de descuento en su primera compra
Trading product for Trend Swing Radar Indicador Key Levels Market Structure, image 1
Trend Swing Radar
Indicador
Versión 1.0, Jul 2026
Windows, Mac
Trading product for Trend Swing Radar Indicador Key Levels Market Structure, image 2
Trading product for Trend Swing Radar Indicador Key Levels Market Structure, image 3
Trading product for Trend Swing Radar Indicador Key Levels Market Structure, image 4
Desde 08/07/2026

Descripción

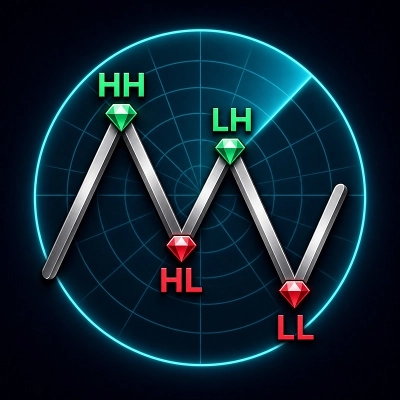
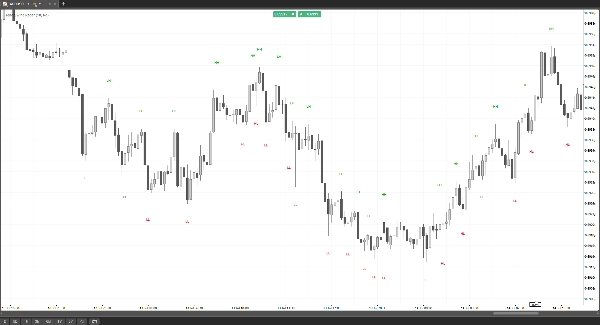
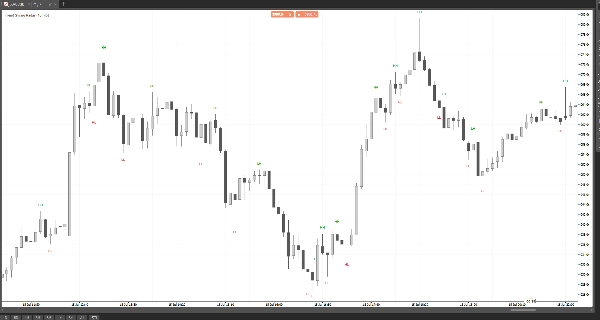
Trend Swing Radar is a visual-only indicator that dynamically follows the active price feed and identifies major Higher High (HH), Higher Low (HL), Lower High (LH) and Lower Low (LL) swing points directly on the cTrader chart.


It is intended exclusively for manual chart analysis and discretionary trading. It is not designed to provide trading signals or numerical data to cBots, automated strategies or other indicators.


Its swing and pullback engine analyses each candle price delivery directly. It does not depend on moving averages, oscillators or other lagging technical indicators to identify swings and structural changes.


Trend Swing Radar is designed for discretionary traders who want to understand price structure without lagging indicators, signal panels or unnecessary chart clutter. It prints clean labels above and below the corresponding swing points, helping traders follow bullish and bearish markets across multiple timeframes and assets.


Key features:


- Automatically identifies HH, HL, LH and LL swing structure

- Dynamically evaluates the active market data feed

- Uses direct candle price delivery instead of lagging technical indicators

- Clean label-only display with no connecting swing lines

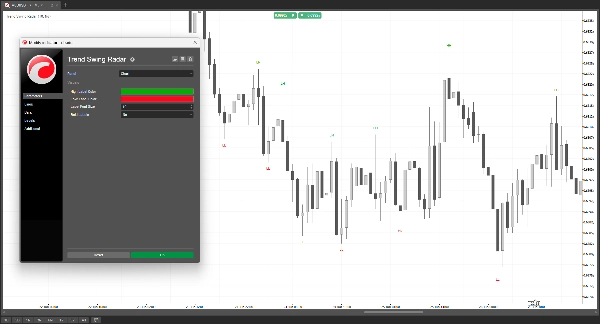
- Customizable label colors, font size and bold style

- No automated trading, alerts or numerical output series

- Intended for manual trading only; no cBot integration or machine-readable signal output

- Requires no file access, network access or Full Access permission


The indicator can be used on forex pairs, metals, indices and other instruments with reliable candle data. Typical uses include trend assessment, pullback analysis, swing identification and adding market context to an existing discretionary trading strategy.


Because the indicator follows the active price feed, developing structure on the currently forming candle may update as prices change. Historical results may also differ between brokers due to differences in candle data and available history.


Trend Swing Radar is a visual analysis tool and does not provide financial advice or guarantee future price direction or trading profitability.

Resumen

Perfil del indicador
Categoría del indicador
Tendencia
Tipo de resultado
Visualización
Requisitos de datos
Únicamente barras

Conversación

Valoraciones de clientes

0.0
Valoraciones: 0
Valoraciones de clientes
Este producto todavía no se ha valorado. ¿Ya lo ha probado? Sea el primero en informar a otros.

Preguntas frecuentes

Key Levels
Market Structure
Support & Resistance
Los productos disponibles a través de cTrader Store, incluidos bots, indicadores y plugins para operar, son proporcionados por desarrolladores de terceros y están disponibles únicamente con fines informativos y de acceso técnico. cTrader Store no es un bróker, por lo que no proporciona asesoramiento de inversión, recomendaciones personales ni ninguna garantía de rentabilidad futura.

Puede interesarle

Indicador
Signal
Trades Opening Range Breakouts Indicator with dynamic stops/targets adapting to market volatility.
Indicador
SMC
Prop
+5
Order Block PRO — Smart Institutional Zone Detector
Indicador
Forex
EURUSD
+7
Institutional Session Levels Pro OHLC,Prev(D,W,M OHLC)
Logotipo de "ADT_bigCandles"
Mejor valorado
4.7
(4)
$20
/
$40
Indicador
ATR
Prop
Outside Candle Detector: Highlights major candles/zones with ATR filter & pattern labels. By Avydel Talbo, prop trader.
Indicador
SMA
Volume
+3
Stoc​h PRO Quad Rotation Signal (QRS) is an advanced technical analysis indicator developed for cTrader.
Indicador
Volume
Imbalance
+5
Professional OrderFlow Footprint Analysis ( Bid/ask, POC, VA, Delta, Absorption, Imbalance )
Indicador
Breakout
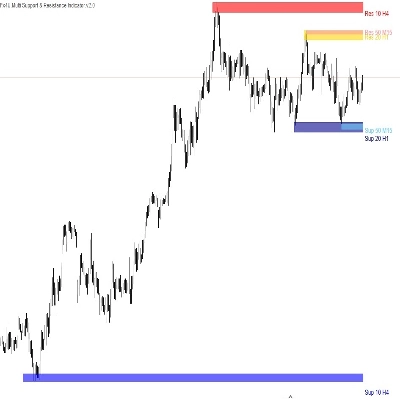
Allow trader to visualize Support & Resistance across different timeframes,give trader an overview of the current market
Indicador
Forex
EURUSD
+5
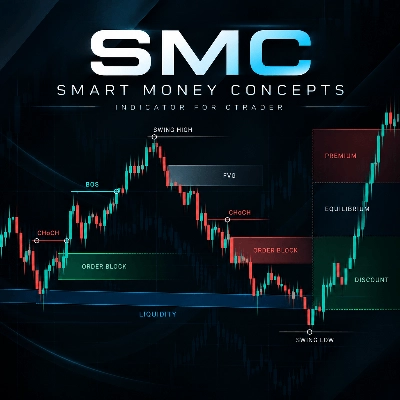
The Smart Money Concepts indicator is an all-in-one overlay tool that automatically detects OB, FVG ecc..
Indicador
ATR
SMC
+20
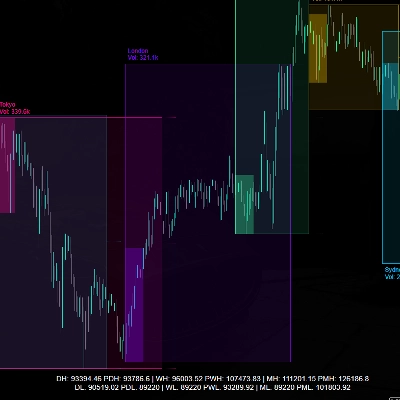
Session boxes, liquidity sweeps and higher‑timeframe levels for intraday trading
Indicador
Volume
Key Levels
+1
Session volume profiles from tick volume: POC, value area high and low, and naked POCs extended until touched.
Indicador
RSI
VWAP
+5
Trend direction, chart signals, reversal zones and volume tools in one configurable indicator.
Indicador
BOS
EMA
+5
Market structure signals graded A to C, each with a drawn trade plan, plus an adaptive trend ribbon and a trend matrix
Indicador
Fibonacci
Key Levels
+1
Explore Elliott wave counts, three swing sizes and example levels with an interactive cTrader chart panel.
Indicador
SMC
VWAP
+5
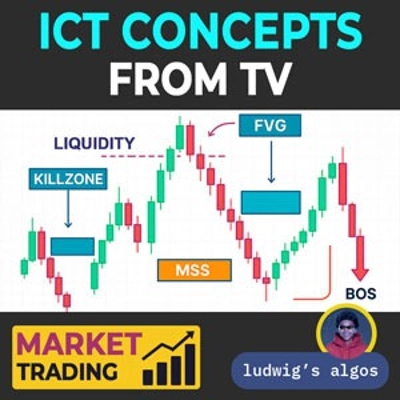
Smart ICT Concepts indicator from TV: combining FVGs, Liquidity, Order Blocks, and Market Structure in one tool.
Indicador
ATR
RSI
+5
Gold Emperor: AI-driven XAUUSD dominance. Dynamic pivots, matrix trend logic, and institutional shield protection.
Indicador
Forex
Crypto
+2
HTF Candle
Indicador
Doji
Wedge
+5
Angora Pattern Recognition is a cTrader indicator that finds, draws and tracks classic chart patterns automatically.
Indicador
RSI
VegaXLR's cTrader StochRSI identifies overbought/oversold RSI levels for precise trade entries.

Precio

Desde 08/07/2026