

Descripción
Zonas ATR MTF de MyZtrade — Zonas de Soporte y Resistencia Basadas en ATR Multitemporales
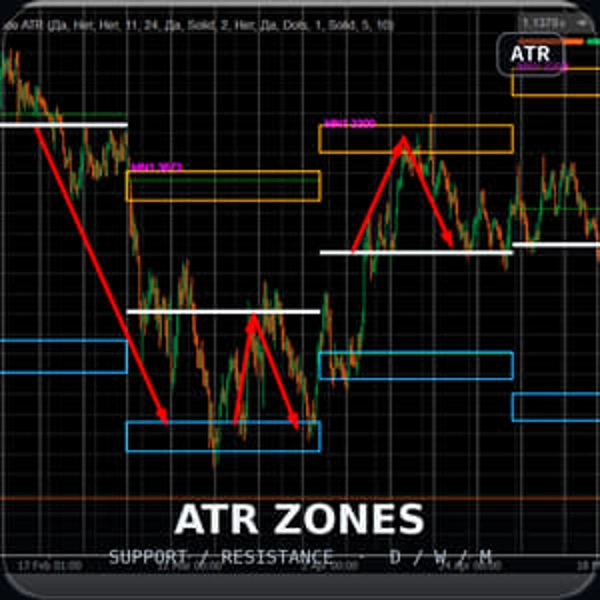
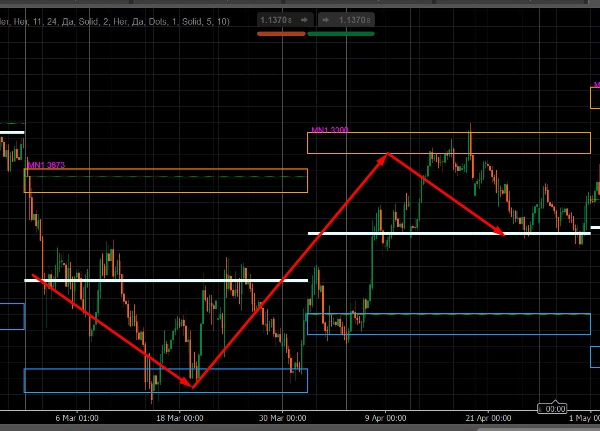
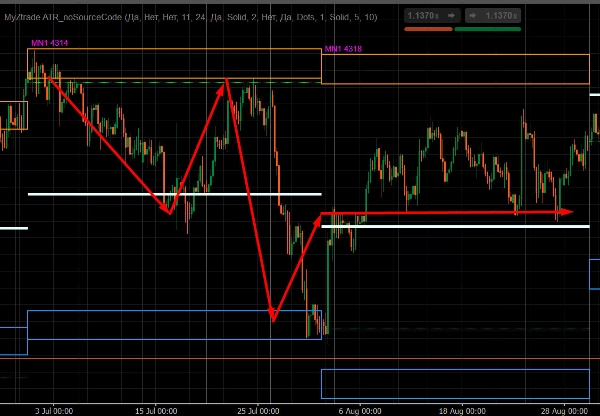
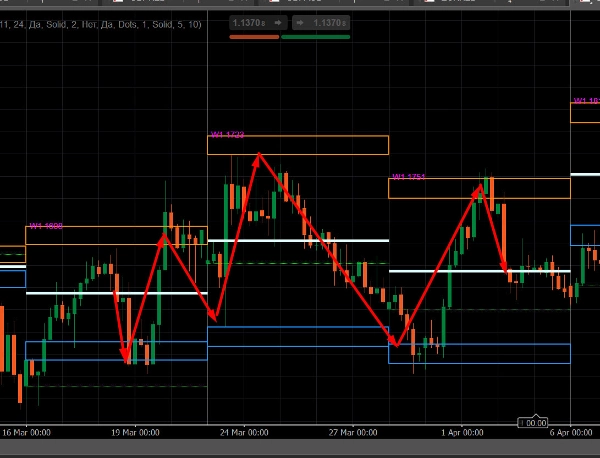
Este indicador dibuja zonas potenciales de reversión (soporte/resistencia) en el gráfico basándose en el rango promedio Alto–Bajo de barras de marcos temporales superiores — Mensual, Semanal y Diario — independiente del propio marco temporal del gráfico.
Qué Hace
Para cada marco temporal habilitado (Mensual / Semanal / Diario), el indicador:
• Calcula el rango promedio (Alto–Bajo) sobre un número especificado de las barras más recientes en ese marco temporal (por defecto: 11 barras)
• Traza zonas rectangulares de resistencia y soporte en el gráfico, desplazadas desde el máximo/mínimo de cada barra por el valor de este rango promedio
• Etiqueta cada zona con el valor de volatilidad en puntos y el prefijo del marco temporal (por ejemplo, MN1 2696, W1 1180, D1 340) — útil cuando múltiples marcos temporales están habilitados simultáneamente
• Además dibuja la línea del precio de apertura de la barra y la línea media dentro de la zona
• Rastrea por separado la barra actual (aún no cerrada) — su zona se mueve en tiempo real conforme se desarrolla la barra
Características Clave
• Múltiples marcos temporales simultáneamente — Mensual, Semanal y Diario pueden habilitarse independientemente entre sí
• No está ligado al marco temporal del gráfico — puedes ver zonas mensuales en un gráfico horario, etc.
• Apariencia totalmente personalizable — colores, grosor y estilo de línea, relleno/contorno de zona, tamaño del texto
• Sirve como guía visual; no genera señales de trading ni contiene lógica de entrada/salida
Resumen
Each zone is labeled with its volatility value in points and the corresponding timeframe prefix (e.g., MN1, W1, D1) to distinguish multiple enabled timeframes. Additional visual elements include the bar’s opening price line and a median line within each zone. The indicator also tracks the current, developing bar in real time, updating its zone dynamically.
Key features include simultaneous display of multiple timeframes, full customization of visual appearance (colors, line styles, text size), and independence from the chart’s timeframe, allowing monthly zones to be viewed on intraday charts. This tool serves as a visual guide for support and resistance levels based on volatility but does not provide trading signals or entry/exit logic.
Valoraciones de clientes
Conversación
Preguntas frecuentes
Más de este autor





















Precio
