
Descripción
¿Qué es LTtradingBox?
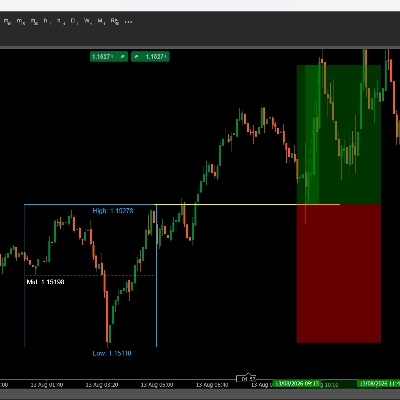
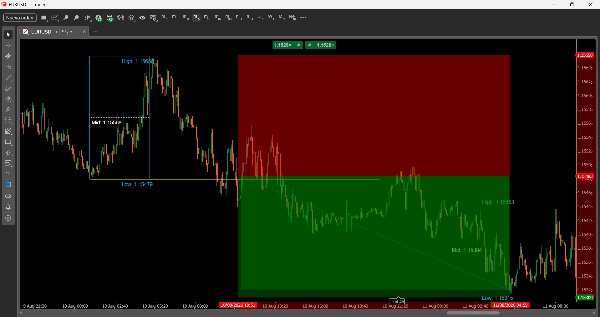
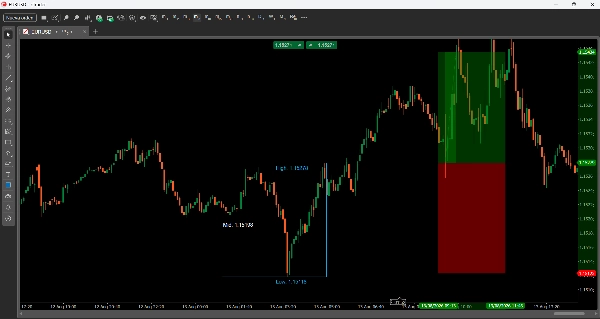
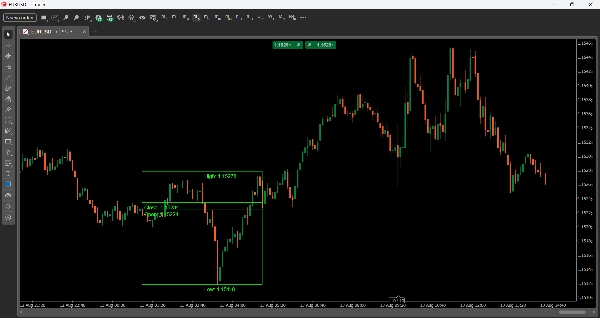
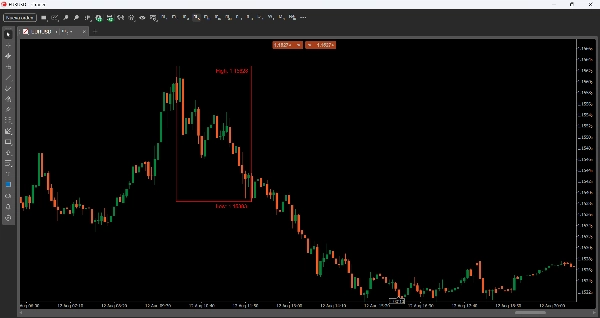
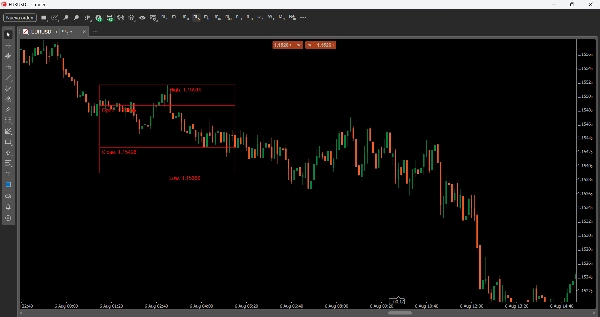
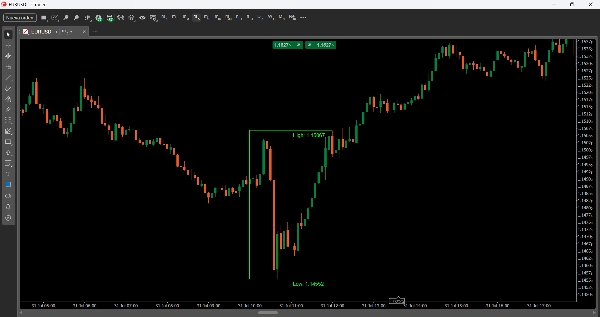
LTtradingBox marca visualmente el rango de precios (alto, bajo, apertura y cierre) de una ventana de tiempo que defines — por ejemplo, la sesión de Londres o Nueva York. La caja cambia automáticamente de color según el resultado de esa sesión: verde si cerró alcista, rojo si cerró bajista, gris si es neutral (o los colores que elijas para cada caso). También añade líneas de referencia (Precio Medio, Tiempo Medio) y un relleno visual opcional, ayudándote a identificar zonas de liquidez, rangos de acumulación y niveles clave para operar de un vistazo.
Parámetros
Configuración de Tiempo
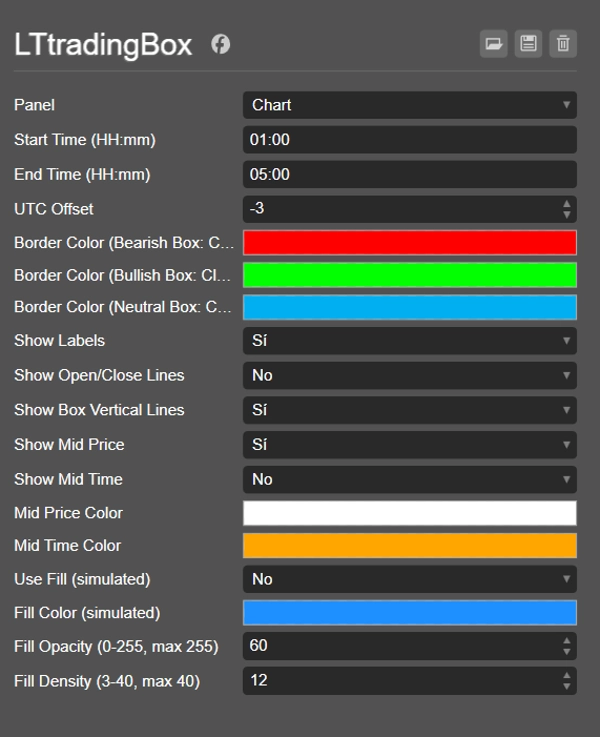
- Hora de Inicio (HH:mm) — Hora de inicio de la caja (formato 24 horas).
- Hora de Fin (HH:mm) — Hora de fin de la caja.
- Desfase UTC — Ajuste horario para que la caja se alinee con tu hora local o la sesión que deseas seguir (por ejemplo, Londres, NY, Asia), independientemente de la zona horaria de tu bróker.
Colores
- Color del Borde (Caja Bajista: Cierre < Apertura) — Color del borde cuando la caja cierra bajista.
- Color del Borde (Caja Alcista: Cierre > Apertura) — Color del borde cuando la caja cierra alcista.
- Color del Borde (Caja Neutral: Cierre == Apertura) — Color del borde cuando el cierre es igual a la apertura.
Opciones de Visualización
- Mostrar Etiquetas — Activa o desactiva las etiquetas de texto que muestran los valores Alto, Bajo, Apertura y Cierre.
- Mostrar Líneas de Apertura/Cierre — Dibuja líneas horizontales que marcan el precio de apertura y cierre dentro de la caja.
- Mostrar Líneas Verticales de la Caja — Habilita el rectángulo completo (4 bordes); si está deshabilitado, solo se muestran las líneas de Alto y Bajo.
- Mostrar Precio Medio — Dibuja una línea punteada en el punto medio entre Alto y Bajo.
- Mostrar Tiempo Medio — Dibuja una línea vertical en el punto medio temporal de la caja.
- Color del Precio Medio / Color del Tiempo Medio — Colores personalizables para esas líneas.
Relleno (relleno visual)
- Usar Relleno (simulado) — Habilita un relleno simulado dentro de la caja (usando líneas delgadas superpuestas).
- Color del Relleno (simulado) — Color del relleno.
- Opacidad del Relleno (0-255, máximo 255) — Nivel de transparencia del relleno.
- Densidad del Relleno (3-40, máximo 40) — Número de líneas usadas para simular el relleno (mayor densidad = relleno más sólido).
Ideas de Trading
- Ruptura y re-test: espera a que el precio rompa el Alto o Bajo de la caja, luego regrese para volver a probar ese nivel como soporte/resistencia antes de entrar en la dirección de la ruptura.
- Reversión en extremos: si el precio toca el Alto o Bajo de la caja sin romper con fuerza, puede señalar un rechazo y un movimiento hacia el lado opuesto de la caja.
- Sesgo direccional por sesión: el color de la caja te da un sesgo rápido (alcista/bajista/neutral) sobre cómo se movió esa sesión, útil para alinear entradas en sesiones posteriores.
- Precio Medio como imán: el punto medio a menudo actúa como zona de reequilibrio — busca entradas cuando el precio regresa al Medio después de un movimiento impulsivo fuerte.
- Comparar cajas consecutivas: dado que cada caja diaria se guarda (a través de su etiqueta de fecha), puedes comparar el rango y sesgo de varias sesiones consecutivas para detectar tendencias a corto plazo.
Resumen
Resumen de IA
LTtradingBox is a customizable trading indicator that visually highlights the price range—high, low, open, and close—within any user-defined time window, such as a specific trading session. The indicator draws a colored box representing this range, automatically changing its border color to green for bullish closes, red for bearish closes, or gray for neutral, with customizable color options. It includes reference lines for the midpoint price and midpoint time, which can be displayed as dotted or vertical lines, aiding in identifying liquidity zones, accumulation areas, and key support/resistance levels.
Users can configure start and end times, apply a UTC offset to align with local or session times, and toggle display options such as labels for price points, open/close lines, full box borders, and visual fills with adjustable color, opacity, and density. The indicator supports trading strategies including breakout and retest of box boundaries, reversal signals at extremes, session-based directional bias, and using the midpoint as a rebalancing zone. It also allows comparison of consecutive session boxes to detect short-term trends. LTtradingBox is designed to assist traders in quickly identifying key levels and market structure within chosen timeframes.
Users can configure start and end times, apply a UTC offset to align with local or session times, and toggle display options such as labels for price points, open/close lines, full box borders, and visual fills with adjustable color, opacity, and density. The indicator supports trading strategies including breakout and retest of box boundaries, reversal signals at extremes, session-based directional bias, and using the midpoint as a rebalancing zone. It also allows comparison of consecutive session boxes to detect short-term trends. LTtradingBox is designed to assist traders in quickly identifying key levels and market structure within chosen timeframes.
Perfil del indicador
Categoría del indicador
Soporte y resistencia
Tipo de resultado
Visualización
Requisitos de datos
Únicamente barras
Señales admitidas
Ruptura
Inversión
Ruptura de nivel
Toque de nivel
Valoraciones de clientes
0.0
Valoraciones: 0
Valoraciones de clientes
Este producto todavía no se ha valorado. ¿Ya lo ha probado? Sea el primero en informar a otros.
Conversación
Preguntas frecuentes
Key Levels
Support & Resistance
Los productos disponibles a través de cTrader Store, incluidos bots, indicadores y plugins para operar, son proporcionados por desarrolladores de terceros y están disponibles únicamente con fines informativos y de acceso técnico. cTrader Store no es un bróker, por lo que no proporciona asesoramiento de inversión, recomendaciones personales ni ninguna garantía de rentabilidad futura.


















Precio
Desde 10/01/2025