Descripción
Harmonic Strategy Suite Pro
La mayoría de los indicadores armónicos dibujan un patrón y te dejan adivinar si vale la pena operar.
Este responde a esa pregunta: cada patrón que encuentra se
reproduce contra la propia historia del gráfico, para que veas la tasa real de aciertos de cada
tipo de patrón en el instrumento y marco temporal frente a ti, antes de arriesgar
nada.
Lo que analiza
El indicador funciona únicamente a partir de la estructura de precios - sin indicadores sobre
indicadores, sin repintar patrones confirmados.
Un motor de pivote original barre el gráfico a través de un rango completo de profundidades de oscilación
a la vez, capturando estructuras en varias escalas en lugar de solo la que
tus ajustes favorecen. Los pivotes consecutivos en la misma dirección se fusionan hasta
el extremo verdadero, dando una secuencia limpia alternante alto-bajo-alto.
Cada ventana consecutiva de cinco pivotes (X-A-B-C-D) se mide luego contra las
definiciones publicadas de Fibonacci de seis patrones armónicos clásicos:
Gartley B en 0.618 de XA, D en 0.786
Bat B en 0.382-0.50, D en 0.886
Butterfly B en 0.786, D en 1.272-1.618
Crab B en 0.382-0.618, D en 1.618
Shark B en 1.13-1.618, D en 0.886-1.13
Cypher B en 0.382-0.618, C en 1.272-1.414, D en 0.786
Un ajuste de tolerancia controla cuán estrictamente deben cumplirse esas proporciones, y cada
detección se puntúa de 0 a 100 según qué tan cerca esté de la proporción ideal - así un
Gartley de libro se distingue claramente de uno más laxo.
El backtester - lo que hace esto diferente
Esta es la parte que la mayoría de las herramientas armónicas no tienen.
Por cada patrón encontrado, el indicador simula la operación que ese patrón
habría producido:
- Se coloca una orden límite en el punto de finalización D.
- Si el precio alcanza el objetivo o el stop ANTES de tocar D, la configuración se
considera invalidada y nunca se convierte en operación - exactamente como se
cancelaría una orden pendiente real.
- Las órdenes no llenadas expiran después de 15 barras.
- Las operaciones llenadas se siguen barra por barra para ver si alcanzaron
Objetivo 1, Objetivo 2, o el stop primero.
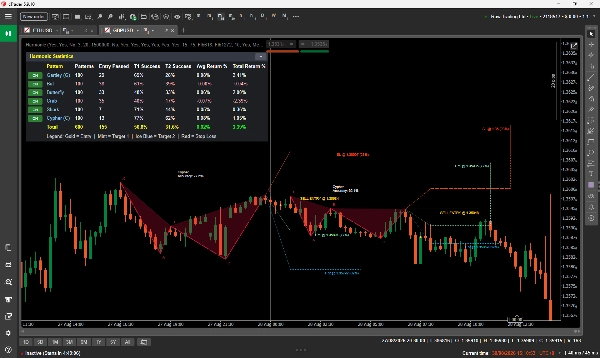
Esos resultados se compilan en un panel en el gráfico que muestra, por tipo de patrón:
Patrones encontrados | Entradas llenadas | Tasa de acierto Objetivo 1 | Tasa de acierto Objetivo 2 |
Retorno promedio | Retorno total
con una fila total combinada. Las filas perdedoras se resaltan, y cada tipo de patrón
tiene un botón ON/OFF que lo filtra instantáneamente fuera del gráfico. El panel
se colapsa a una sola barra de título cuando quieres una vista clara.
Puedes ver de un vistazo que, por ejemplo, Cypher rara vez se llena pero convierte
a menudo en este par, mientras que Crab se llena más y convierte menos. Eso es un
juicio sobre el que puedes actuar - y se mide con los datos de tu bróker, no
citado de un libro.
Cómo leer el gráfico
Cada patrón se dibuja como su esqueleto X-A-B-C-D con triángulos sombreados. El
sombreado no es decorativo: cuanto más a menudo ese tipo de patrón alcanzó el Objetivo 1 en
el backtest, más sólido es su relleno, por lo que las estructuras fiables destacan
inmediatamente.
Cada patrón lleva su plan de operación completo:
Línea de entrada dorada, etiquetada BUY ENTRY / SELL ENTRY con el precio exacto
Objetivo 1 menta, etiquetado con el precio y la tasa de acierto T1 de ese patrón
Objetivo 2 azul hielo, mismo tratamiento
Stop loss rojo
El estilo de línea te dice qué pasó. Un nivel que el precio realmente alcanzó se
dibuja SÓLIDO y se detiene en la barra que fue tocada. Un nivel que nunca se alcanzó
permanece PUNTEADO y se extiende hasta el final de la configuración. Un punto dorado marca la
barra de confirmación. Las etiquetas se colocan al final de su propia línea, con un líder dibujado
cuando es necesario moverlas para mantener la legibilidad.
El nombre del patrón y la precisión se imprimen junto a cada estructura, posicionados debajo
de configuraciones alcistas y encima de bajistas para que nunca se superpongan con la acción del precio.
Configuraciones clave
Incluir patrones alcistas / bajistas Filtro de dirección de operación
Activar Gartley ... Activar Cypher Apagar patrones individuales completamente
Buscador de pivotes Profundidad mínima / máxima Rango de sensibilidad de oscilación (3-20). Un
mínimo más alto encuentra menos, pero más grandes
estructuras
Error permitido en la proporción Fib % Tolerancia de proporción. 15% es un
valor predeterminado equilibrado; bájalo para detecciones solo de libro
Stop Loss Distancia Colocación del stop más allá de D, como un
porcentaje del rango AD
Objetivo 1 / Objetivo 2 Proporción Múltiplos de Fibonacci de AD
Barras históricas a escanear Profundidad del escaneo y por tanto la
muestra estadística
Máximo de patrones a dibujar Claridad del gráfico vs completitud
Mostrar panel de estadísticas Panel encendido/apagado
Colores y tamaño de fuente Control visual completo
Para quién es
Adecuado para traders que ya entienden los patrones armónicos y quieren
automatizar el trabajo pesado más la evidencia adjunta - y para traders intermedios que
conocen las formas pero no están seguros de cuáles confiar.
Es genuinamente útil para traders swing e intradía en cualquier instrumento y cualquier
marco temporal: forex, índices, commodities y criptomonedas funcionan, porque la lógica
es pura geometría de precios.
Si nunca has visto un patrón armónico antes, lee primero los conceptos básicos.
El indicador los encontrará por ti, pero asume que sabes qué te está intentando decir un Gartley.
Uso típico
1. Adjunta al gráfico y deja que el panel construya su muestra.
2. Observa qué tipos de patrones realmente funcionan en ese instrumento y
marco temporal, y apaga los débiles.
3. Espera una nueva finalización en D, revisando la puntuación de precisión y la
tasa histórica de aciertos de ese tipo.
4. Usa la entrada, stop y objetivos dibujados como plan, ajustados a tu propio riesgo.
Notas importantes - por favor lee
- Esto es una HERRAMIENTA DE ANÁLISIS. No coloca, modifica ni cierra ninguna orden.
No hay auto-trading y nunca toca tu cuenta.
- El rendimiento pasado no es una predicción. El panel reporta lo que estos
patrones hicieron históricamente en los datos cargados. Es evidencia para una
decisión, no una garantía de la siguiente.
- Las estadísticas necesitan una muestra. cTrader solo da al indicador las barras que
el gráfico ha cargado realmente, así que desplázate hacia atrás para cargar historia antes de juzgar
los números - la diferencia entre unos cientos de barras y varios
miles es la diferencia entre ruido y una muestra usable.
- Los retornos se muestran como porcentaje del precio. Un par de forex naturalmente
mostrará porcentajes menores que un índice o una materia prima; compara lo similar con
lo similar.
- Las tasas de llenado de entrada son realísticamente bajas por diseño. Muchas configuraciones armónicas
nunca se llenan porque el precio se aleja de D primero. El indicador cuenta
eso honestamente como no llenado en lugar de favorecer las estadísticas.
- Los escaneos profundos hacen el trabajo real. Si aumentas el conteo de barras en una máquina lenta
y ves una pausa en cada nueva barra, reduce las Barras Históricas a Escanear o aumenta
la profundidad mínima del pivote.
Solo análisis. Sin DLLs. Sin conexiones externas. Nunca envía, modifica ni
cierra una orden.
Resumen
A key feature is its integrated backtester, which simulates trades for each pattern found on the chart’s historical data. It places hypothetical limit orders at pattern completion points (D), tracks whether targets or stops are hit, and accounts for unfilled orders and invalidated setups. Results are summarized in an on-chart dashboard showing statistics such as patterns found, entries filled, hit rates for two targets, average and total returns per pattern type, with options to filter patterns on or off.
Patterns are visually displayed with their X-A-B-C-D structure, trade entry, stop loss, and target levels, using line styles and shading to indicate historical success rates and trade outcomes. The indicator supports customization of pattern inclusion, pivot sensitivity, Fibonacci ratio tolerance, stop and target distances, and visual settings.
Designed for traders familiar with harmonic patterns, it suits swing and intraday trading across instruments and timeframes including forex, indices, commodities, and crypto. It functions solely as an analysis tool without order execution capabilities.








![Logotipo de "Gaussian Channel [Iridio Capital]"](https://cdn.ctrader.com/image/webp/2c4f9ca9-4e9b-476d-b5a6-787c8095032b_61546)