
说明
IR Open Connector
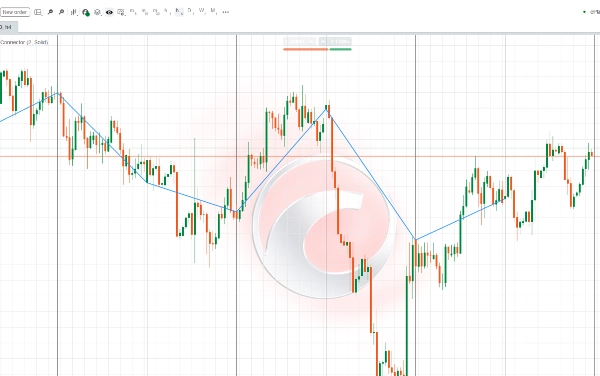
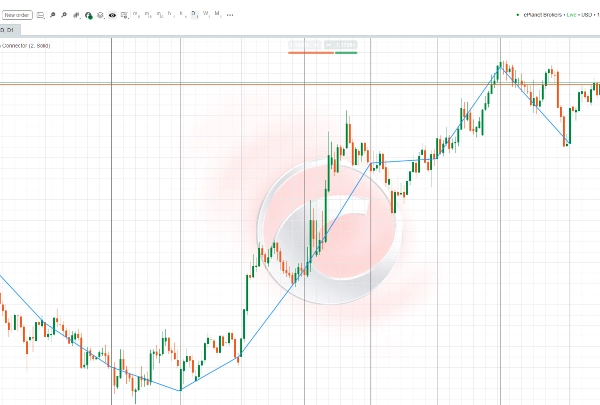
该指标旨在根据当前图表的时间框架连接更高时间框架蜡烛的开盘价:
- 如果时间框架低于一小时 → 连接每日蜡烛的开盘价。
- 如果时间框架为4小时 → 连接每周蜡烛的开盘价。
- 如果时间框架高于4小时但低于每周 → 连接每月蜡烛的开盘价。
这使交易者能够直接在图表上清晰地看到更高周期(日线、周线、月线)的关键开盘水平。这些水平通常作为关键的支撑和阻力区域、潜在的趋势启动区以及市场分析中的重要参考点。
线条的颜色、粗细和样式均可完全自定义,赋予您灵活性以适应个人交易风格的显示需求。
این اندیکاتور طراحی شده تا نقاط باز شدن کندلهای تایمفریمهای بالاتر را بسته به تایمفریم فعلی شما به هم متصل کند:
- اگر تایمفریم کمتر از یک ساعت باشد → باز شدن کندلهای روزانه را به هم وصل میکند.
- اگر تایمفریم چهارساعته باشد → باز شدن کندلهای هفتگی را به هم وصل میکند.
- اگر تایمفریم بزرگتر از چهارساعته و کوچکتر از هفتگی باشد → باز شدن کندلهای ماهانه را به هم وصل میکند.
این ویژگی به معاملهگر کمک میکند تا به سادگی سطوح مهم شروع دورههای بزرگتر (روزانه، هفتگی، ماهانه) را روی نمودار مشاهده کند. این سطوح اغلب بهعنوان نقاط کلیدی حمایت و مقاومت، شروع روندهای جدید یا محدودههای معاملاتی مهم در نظر گرفته میشوند.
با تنظیم رنگ، ضخامت و نوع خط، میتوانید نمایش این خطوط را مطابق با سبک معاملاتی خود شخصیسازی کنید.
摘要
AI 摘要
IR Open Connector is a trading indicator that visually links the opening prices of higher timeframe candles based on the current chart timeframe. Specifically, it connects daily candle opens when the chart timeframe is below one hour, weekly candle opens when the timeframe is four hours, and monthly candle opens when the timeframe is higher than four hours but lower than weekly. This functionality enables traders to easily identify key opening levels from larger timeframes directly on their charts. These levels often act as significant support and resistance zones, potential trend initiation points, and important reference markers in market analysis. The indicator allows full customization of line color, thickness, and style to suit individual trading preferences.
指标配置
客户评价
0.0
评价:0
客户评价
该产品尚无评价。已经试过了?抢先告诉其他人!
讨论
常见问答
cTrader Store 提供的所有产品,包括交易机器人、指标和插件,均由第三方开发者提供,仅供信息参考和技术访问之用。cTrader Store 并非经纪商,不提供投资建议、个人推荐或任何未来业绩保证。


价格
5.17K
免费安装