

Deskripsi
Sistem ATR Advanced Volatility & Trend
Average True Range (ATR) standar adalah alat yang hebat untuk mengukur volatilitas pasar, tetapi dalam bentuk defaultnya, itu hanya berupa satu garis tunggal yang sulit dibaca. Ini memberi tahu Anda apakah volatilitas tinggi atau rendah, tetapi tidak memberi tahu Anda cara memperdagangkannya.
The ATR Advanced mengubah metrik dasar ini menjadi sistem perdagangan visual lengkap. Dengan memperkenalkan Garis Sinyal Volatilitas, Directional Paintbars, dan Histogram Momentum, ini memberi tahu Anda tidak hanya kapan pasar bergerak, tetapi juga seberapa besar dorongan di balik tren saat ini.
Fitur Utama dari VERSI LENGKAP:
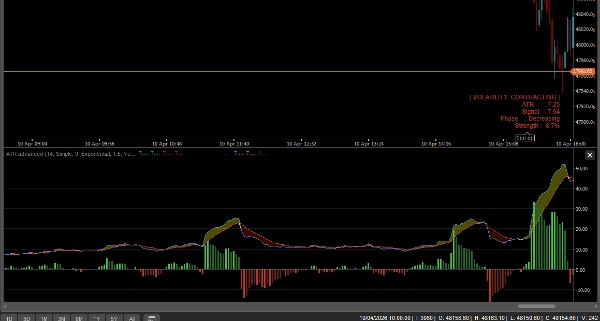
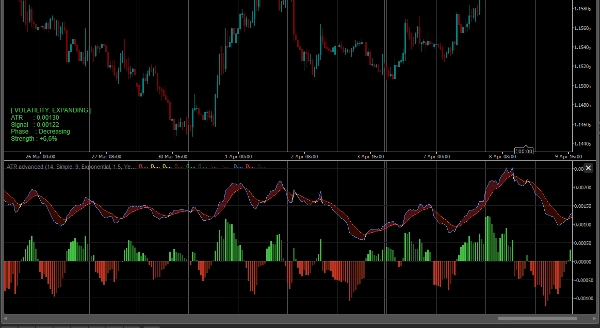
- Awan Perluasan Volatilitas: Kami menambahkan Moving Average (Garis Sinyal) ke ATR. Ruang antara ATR dan Garis Sinyalnya diisi dengan Awan dinamis.
-
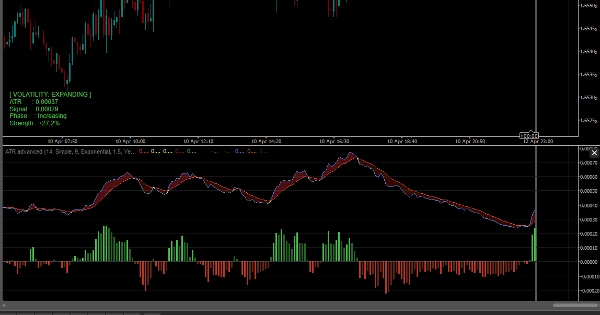
- Awan Hijau (Melebar): Volatilitas meningkat. Pasar mulai bergerak dan tren kuat.
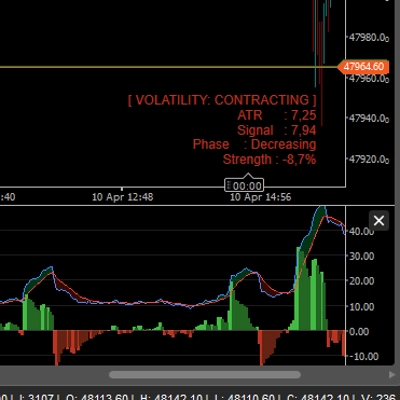
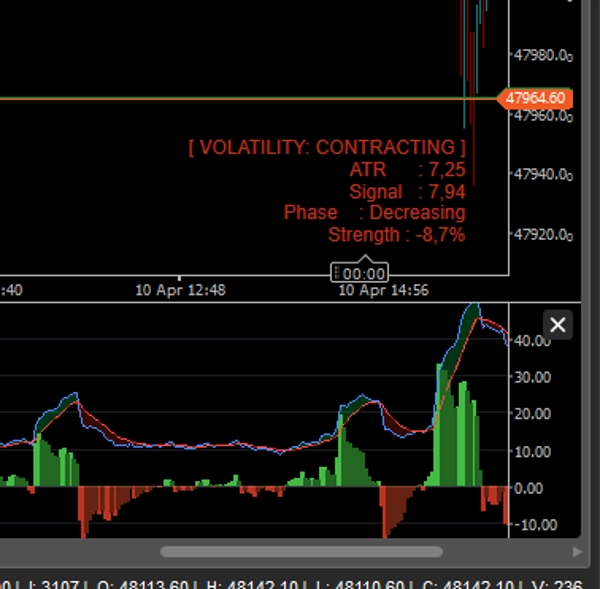
- Awan Merah (Menyusut): Volatilitas menurun. Pasar sedang konsolidasi atau bergerak dalam rentang.
- Histogram Momentum: Histogram khusus di bagian bawah melacak perbedaan tepat antara ATR dan Garis Sinyal, membantu Anda mendeteksi lonjakan volatilitas sebelum benar-benar terjadi.
- Pewarnaan Bar Pintar (Arah + Volatilitas): Ini adalah fitur utama. Indikator membaca baik arah harga (Bullish/Bearish) DAN kondisi volatilitas, mewarnai lilin Anda sesuai:
-
- Hijau/Merah Cerah: Tren Kuat + Volatilitas Melebar (Sempurna untuk perdagangan breakout dan tren).
- Hijau/Merah Gelap: Tren Lemah + Volatilitas Menyusut (Peringatan: Momentum memudar).
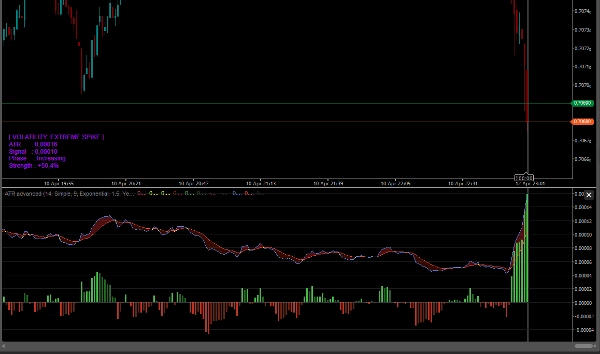
- Deteksi Volatilitas Ekstrem: Ketika ATR melonjak sangat tinggi secara abnormal (misalnya, selama peristiwa berita besar atau puncak blow-off), lilin berubah menjadi Ungu (Ekstrem), memperingatkan Anda tentang potensi klimaks atau breakout besar.
- Dashboard Info Real-Time: Panel ramping di grafik menampilkan nilai ATR tepat, Fase Volatilitas (Melebar/Menyusut), dan pembacaan kekuatan dalam persentase.
- Sepenuhnya Tidak Terkunci: Perdagangkan pada simbol APA PUN (Forex, Crypto, Indeks, Saham) dan kerangka waktu APA PUN tanpa batasan. Akses seumur hidup.
Bagaimana cara memperdagangkannya?
- Breakout: Hindari berdagang saat Awan Volatilitas berwarna Merah (Menyusut). Tunggu ATR menembus di atas Garis Sinyal (Awan berubah menjadi Hijau) dan lilin Anda berwarna Hijau Cerah atau Merah Cerah. Ini mengonfirmasi breakout yang nyata dan berpeluang tinggi.
- Trailing Stops: Tetap dalam perdagangan yang menang selama Awan Volatilitas tetap Hijau. Setelah menembus ke bawah dan berubah Merah, itu berarti momentum habis—waktu yang tepat untuk mengambil keuntungan.
- Peringatan Klimaks: Jika Anda sedang dalam tren dan lilin tiba-tiba berubah Ungu, berhati-hatilah! Ini menunjukkan lonjakan volatilitas ekstrem, yang sering terjadi di akhir tren tepat sebelum pembalikan tajam.
Ringkasan
Ringkasan AI
ATR Advanced is a volatility and trend indicator that enhances the standard Average True Range (ATR) by providing a comprehensive visual trading system. It integrates a Volatility Signal Line (a moving average of ATR) and fills the area between ATR and this line with dynamic Volatility Expansion Clouds. Green clouds indicate expanding volatility and strong trends, while red clouds signal contracting volatility and market consolidation.
Key features include a Momentum Histogram that tracks the difference between ATR and its Signal Line to identify volatility breakouts early, and smart bar coloring that reflects both price direction and volatility state. Bright green/red bars denote strong trends with expanding volatility, dark green/red bars indicate weak trends with contracting volatility, and purple bars warn of extreme volatility spikes often associated with trend climaxes or major events.
The indicator also includes a real-time on-chart dashboard displaying ATR values, volatility phases, and strength percentages. It supports all symbols—including Forex, cryptocurrencies, indices, and stocks—and any timeframe without limitations.
Traders can use it to confirm breakouts when volatility clouds turn green and bars brighten, manage trailing stops by monitoring volatility contraction, and receive warnings of potential trend reversals during extreme volatility spikes.
Key features include a Momentum Histogram that tracks the difference between ATR and its Signal Line to identify volatility breakouts early, and smart bar coloring that reflects both price direction and volatility state. Bright green/red bars denote strong trends with expanding volatility, dark green/red bars indicate weak trends with contracting volatility, and purple bars warn of extreme volatility spikes often associated with trend climaxes or major events.
The indicator also includes a real-time on-chart dashboard displaying ATR values, volatility phases, and strength percentages. It supports all symbols—including Forex, cryptocurrencies, indices, and stocks—and any timeframe without limitations.
Traders can use it to confirm breakouts when volatility clouds turn green and bars brighten, manage trailing stops by monitoring volatility contraction, and receive warnings of potential trend reversals during extreme volatility spikes.
Profil indikator
Kategori indikator
Momentum
Tipe output
Visualisasi
Sinyal
Filter
Persyaratan data
Hanya batang
Sinyal yang didukung
Kekuatan tren
Volatilitas
Diskusi
Ulasan pelanggan
4.3
Ulasan: 3
5 | 33 % | |
4 | 67 % | |
3 | 0 % | |
2 | 0 % | |
1 | 0 % |
Ulasan pelanggan
April 24, 2026
20 signals gives enough for a first read, and the signal gets compared with context.
April 18, 2026
3 percent DD is the line to watch, and the log becomes easier to read.
Pertanyaan umum
ATR
Moving Average
Produk-produk yang tersedia melalui cTrader Store, termasuk bot trading, indikator, dan plugin, disediakan oleh pengembang pihak ketiga serta hanya ditujukan untuk akses teknis dan informasi. cTrader Store bukan broker dan tidak menyediakan saran investasi, rekomendasi pribadi, atau jaminan apa pun tentang kinerja di masa mendatang.






























Harga
32
Penjualan
992
Instal gratis