Description
Quelles données de marché il analyse
London Open Signal charge des années d'historique intrajournalier du symbole associé directement depuis votre courtier (résolution M15 ou H1, à votre choix) et reconstitue chaque jour de trading passé en deux fenêtres : une plage complète de "jour" (heure de début/fin configurable) et la session de Londres elle-même (heure d'ouverture/fermeture configurable, selon l'heure du serveur du courtier). Pour chaque session historique, il simule deux trades hypothétiques — un long et un short — en utilisant un stop et un objectif fixes, sortant à la clôture de la session si aucun n'est atteint, net d'une allocation pour le spread et les coûts. Il teste ensuite cinq idées simples par rapport à ces résultats pour voir laquelle, le cas échéant, a réellement prédit le résultat : la série actuelle de gains/pertes nocturnes, le jour de la semaine, la position du prix d'ouverture de la session dans la plage de la veille, le gap par rapport à la clôture de la veille, et si la plage de la veille était exceptionnellement large ou étroite.
Comment interpréter les signaux et éléments visuels
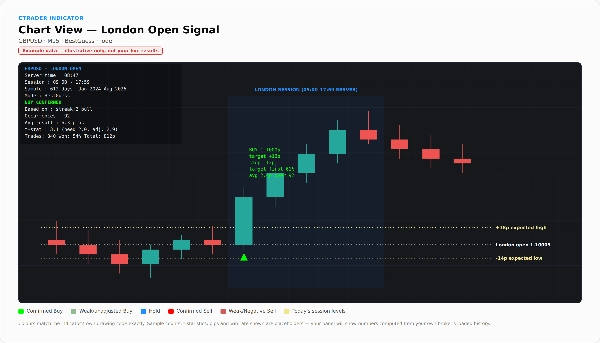
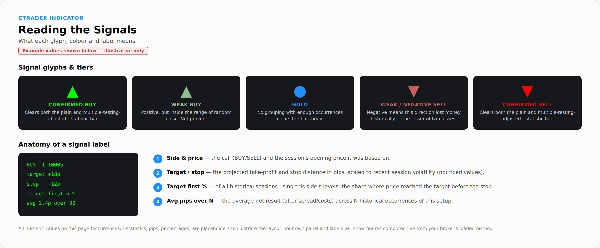
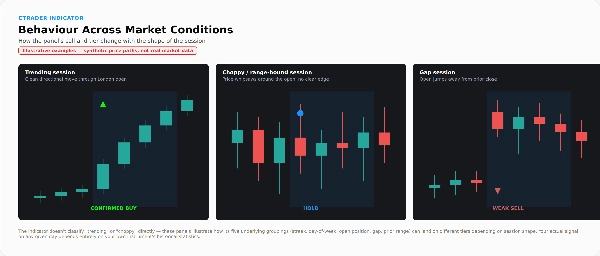
Une flèche verte vers le haut indique un appel à l'achat à l'ouverture de Londres ce jour-là ; une flèche rouge vers le bas indique une vente ; un point bleu indique une position neutre (aucun avantage défendable trouvé). Ces flèches historiques sont calculées en mode walk-forward — chacune utilise uniquement les données qui auraient été disponibles avant ce jour, jamais le résultat du jour lui-même.
Le panneau sur le graphique (en haut à gauche) affiche l'appel du jour et une étiquette de niveau : CONFIRMÉ, CONFIRMÉ (non ajusté), FAIBLE ou NÉGATIF. Cela vous indique à quel point faire confiance à la flèche — FAIBLE signifie que l'avantage apparent est dans la plage du bruit aléatoire, et NÉGATIF signifie que cette direction a en fait perdu de l'argent historiquement et que la flèche représente seulement la moindre des deux pertes. Le panneau montre également sur quel regroupement l'appel est basé, combien de fois il s'est produit, le résultat moyen, la statistique t par rapport aux seuils simples et ajustés pour tests multiples, et — surtout — un tableau de bord walk-forward en cours : combien de trades l'outil aurait réellement pris, taux de réussite, total de pips, pips par trade, et la pire perte maximale. Si ce total en cours est stable ou négatif, le panneau l'indique directement.
Trois superpositions optionnelles ajoutent du détail : un tableau complet des résultats (chaque regroupement testé, avec taille d'échantillon et statistique t pour les deux directions), un "laboratoire stop/objectif" qui montre comment le taux de réussite change uniquement selon l'emplacement du stop et de l'objectif — pour souligner qu'un taux de réussite élevé n'est pas synonyme d'un avantage réel — et une boîte des niveaux de session montrant la taille typique du mouvement haussier, baissier et de la plage totale de la session de Londres aux percentiles médian/75e/90e. Des lignes pointillées sur la session d'aujourd'hui marquent l'ouverture et le haut/bas attendu ajusté à la volatilité.
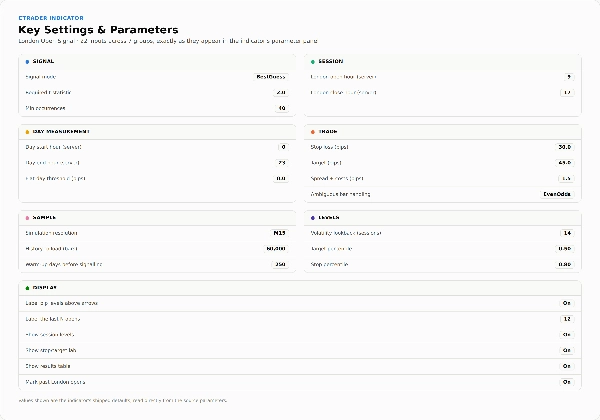
Paramètres et réglages clés
- Signal : Mode (Confirmé uniquement vs Meilleure estimation), statistique t requise, occurrences minimales avant qu'un regroupement soit pris en compte
- Session : Heure d'ouverture de Londres, heure de fermeture de Londres (heure du serveur du courtier)
- Mesure du jour : Heure de début/fin du jour, seuil de journée plate (pips)
- Trade : Stop loss (pips), Objectif (pips), allocation spread/coûts (pips), gestion des barres ambiguës (Pessimiste / Chances égales / Optimiste, pour les barres touchant à la fois stop et objectif)
- Échantillon : Résolution de simulation (H1/M15), historique à charger (barres), jours de chauffe avant que l'outil commence à signaler
- Niveaux : Retour sur volatilité (sessions), percentile cible, percentile stop
- Affichage : Étiqueter les flèches / compter les étiquettes, afficher les niveaux de session, afficher le laboratoire stop-objectif, afficher le tableau des résultats, marquer les ouvertures de Londres passées
Cas d'utilisation typiques et scénarios de trading
Consulter le panneau avant l'ouverture de Londres pour l'appel actuel, son niveau, et la plage de session attendue pour la journée. Rechercher si un motif simple et interprétable a tenu statistiquement pour une paire donnée sur son propre historique — et voir honnêtement si ce motif résiste à la correction liée au test simultané de plusieurs idées. Utiliser les projections au niveau de la session (haut/bas attendu) pour planifier des objectifs ou stops indépendamment de l'appel achat/vente lui-même. Il n'est pas conçu pour une exécution automatisée sans surveillance — c'est un indicateur, pas un cBot, et il ne place jamais de trade lui-même.
À qui cela convient le mieux
Les traders qui veulent voir le véritable historique vérifié en walk-forward derrière un signal plutôt que de croire une affirmation sans preuve, et qui sont à l'aise avec la lecture d'une statistique t et d'un chiffre de drawdown à côté d'une flèche. Les traders discrétionnaires de la session de Londres qui apprécient le contexte de la plage de session même lorsqu'ils choisissent d'ignorer l'appel achat/vente. Il n'est délibérément pas conçu pour quelqu'un cherchant un système "plug-and-play" « suivez simplement la flèche » — l'outil évalue ses propres signaux et vous dira clairement lorsque les chiffres ne soutiennent pas leur trading.
Limitations importantes et notes d'utilisation
- La performance est calculée en direct à partir de l'historique du courtier réellement chargé lorsque l'indicateur s'exécute — ce n'est pas un fichier de backtest fixe et pré-généré, donc les résultats peuvent varier selon le courtier/le compte et nécessiteront un historique suffisamment chargé (augmentez "Historique à charger" si le panneau signale un manque de données).
- L'ajustement pour tests multiples est une heuristique, pas une garantie — un seuil ajusté réduit, mais n'élimine pas, la probabilité qu'un résultat semble significatif par hasard seul.
- Les cinq idées testées sont des classificateurs simples à facteur unique, vérifiés indépendamment plutôt que combinés — un choix délibéré pour garder l'outil interprétable et éviter d'aggraver davantage le risque de surajustement.
- En mode Meilleure Estimation, l'indicateur affiche toujours une direction, y compris les appels de niveau NÉGATIF — lisez toujours l'étiquette de niveau, pas seulement la flèche.
- Les remplissages stop/objectif simulés utilisent une hypothèse simplifiée pour les barres touchant les deux niveaux dans la même bougie ; l'exécution réelle peut différer.
- Purement basé sur le prix/les statistiques — pas de nouvelles, fondamentaux ou entrées multi-actifs.
- Visuel et analytique uniquement ; il ne place pas de trades.
Résumé
The indicator tests five simple, independent factors—overnight streak, day of the week, opening price position within the previous day’s range, gap size, and previous day’s range width—to identify statistically significant edges. Signals are displayed as arrows on the chart: green for Buy, red for Sell, and blue for Hold, with a tier label (CONFIRMED, WEAK, NEGATIVE) indicating the confidence level based on walk-forward testing.
A panel shows detailed statistics including win rate, total pips, t-statistics, and drawdown, updated live from broker data. Optional overlays provide a full results table, stop/target sensitivity analysis, and session-level range projections. The tool is purely analytical and visual; it does not execute trades and is intended for traders comfortable interpreting statistical metrics alongside signals.