
Deskripsi
TrendFallowing: adalah indikator teknis canggih untuk platform cTrader yang menggabungkan beberapa pendekatan analitis menjadi satu solusi. Dikembangkan untuk trader yang mencari konfirmasi tren melalui konvergensi indikator, ini menawarkan pandangan pasar lengkap dengan sinyal tepat dan filter validasi.
TONTON VIDEO PENGENALAN TENTANG STRATEGI OPERASIONAL!
🎯 STRATEGI PENGGUNAAN
1. Perdagangan Mengikuti Tren
Aplikasi: Identifikasi dan ikuti tren yang sudah terbentuk
Timeframe: H4, D1 untuk posisi jangka panjang
Pengaturan: ADX > 25, Volume di atas rata-rata
Manajemen Risiko: Stop-loss di bawah rata-rata bergerak 50-periode
2. Perdagangan Swing
Aplikasi: Menangkap pergerakan jangka menengah
Timeframe: H1, H4
Pengaturan: Filter volume diaktifkan, konfirmasi oleh Volume Profile
Target: Volume Profile POC sebagai TP
3. Perdagangan Breakout
Aplikasi: Masuk pada breakout support/resistance
Pengaturan: Volume PVA untuk mengonfirmasi kekuatan pergerakan
Konfirmasi: ADX naik + Volume di atas rata-rata
4. Scalping (Timeframe Lebih Pendek)
Aplikasi: Perdagangan cepat dengan beberapa konfirmasi
Timeframe: M1, M5
Pengaturan: Filter volume ketat dan Momentum
🔧 CARA KERJA INDIKATOR
INTI ADX & DI
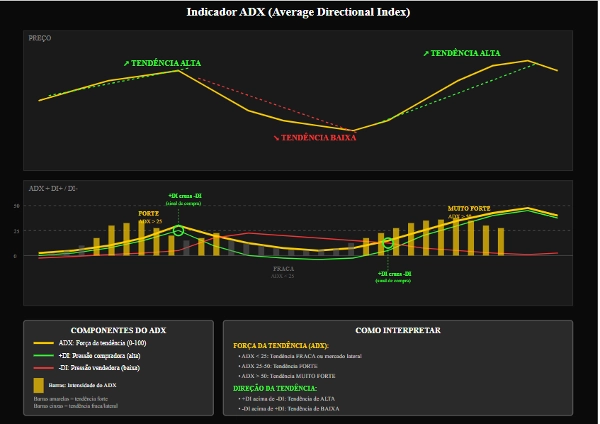
ADX (Average Directional Index)
Fungsi: Mengukur kekuatan tren
Interpretasi:
0-25: Tren lemah/pergerakan menyamping
25-50: Tren kuat
50+: Tren sangat kuat
Penggunaan Praktis: Hindari perdagangan saat ADX < 20
+DI / -DI (Indikator Arah)
+DI: Kekuatan pembeli
-DI: Kekuatan penjual
Sinyal: Persilangan +DI di atas -DI (beli) dan sebaliknya
Kemiringan ADX (ADX Slope)
Fungsi: Mengukur percepatan tren
Plot: Histogram cyan
Sinyal: Nilai positif menunjukkan tren yang menguat
FILTER VOLUME
Filter Volume MA
Fungsi: Validasi sinyal dengan volume di atas rata-rata
Parameter: Periode 20, Pengali 1.0
Penggunaan: Konfirmasi minat institusional
Volume PVA (Price Volume Analysis)
Warna dan Makna:
Hijau: Beli dengan volume sangat tinggi (>150% rata-rata)
Biru: Beli dengan volume tinggi
Merah: Jual dengan volume sangat tinggi
Merah muda: Jual dengan volume tinggi
Kuning: Pin Bar/Kelelahan dengan break support
VOLUME PROFILE
POC (Point of Control)
Fungsi: Harga dengan volume perdagangan tertinggi
Penggunaan: Target alami untuk perdagangan, support/resistance dinamis
Area Nilai
Fungsi: Zona tempat 70% volume diperdagangkan
Interpretasi:
Harga di atas: Tren naik
Harga di bawah: Tren turun
Di dalam: Kemungkinan pergerakan menyamping
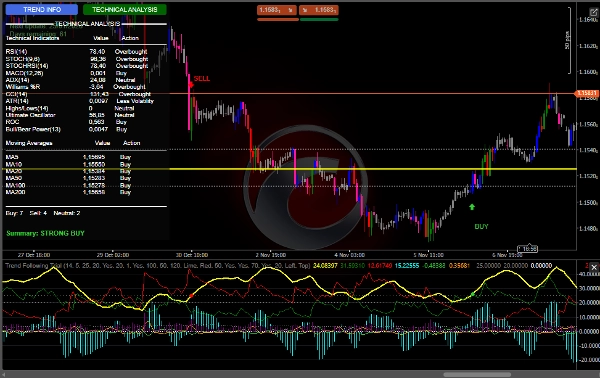
Panel Indikator
RSI: Jual berlebih (<30) / Beli berlebih (>70)
MACD: Momentum
Williams %R: Kondisi Ekstrem
CCI: Identifikasi Pembalikan
Stochastic: Momentum jangka pendek
Ultimate Oscillator: Momentum multi-timeframe
Moving Averages
Set lengkap MA (5, 10, 20, 50, 100, 200)
Analisis penyelarasan untuk tren
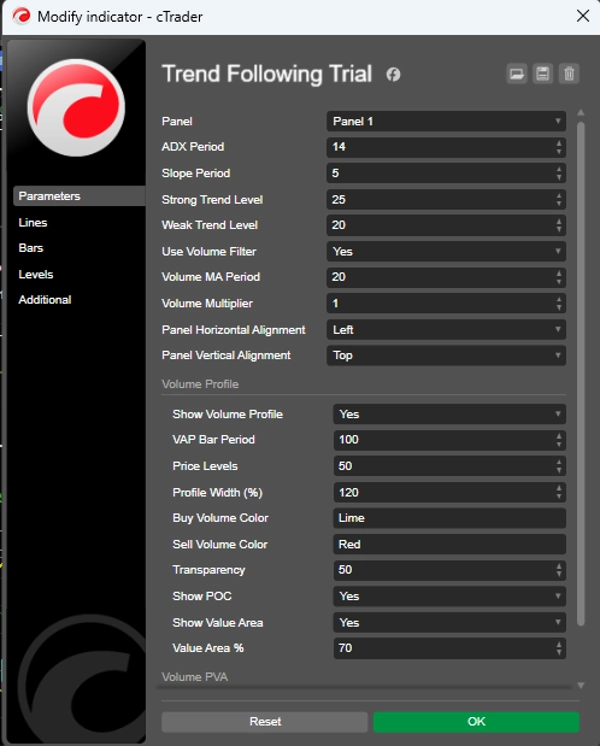
⚙️ PENGATURAN YANG DIREKOMENDASIKAN
Pengaturan Konservatif
Periode ADX: 14
Periode Kemiringan: 5
Level Tren Kuat: 25
Level Tren Lemah: 20
Gunakan Filter Volume: true
Periode Volume MA: 20
Pengali Volume: 1.2
Pengaturan Agresif
Periode ADX: 10
Periode Kemiringan: 3
Level Tren Kuat: 20
Level Tren Lemah: 15
Gunakan Filter Volume: true
Periode Volume MA: 14
Pengali Volume: 1.0
Volume Profile (Direkomendasikan)
Tampilkan Volume Profile: true
Periode Bar VAP: 100
Level Harga: 50
Persentase Area Nilai: 70
Tampilkan POC: true
🎨 SUMBER DAYA VISUAL
Antarmuka Pengguna
Panel Dinamis: Informasi waktu nyata
Tombol Interaktif: Beralih antara analisis
Warna Intuitif: Kode berbasis fungsi
Sinyal Grafis
Panah: Entri BELI/JUAL
Suara: Peringatan terdengar
Warna Bar: Analisis PVA terintegrasi


