present
가입하고 첫 구매 시 $50 할인을 받으세요
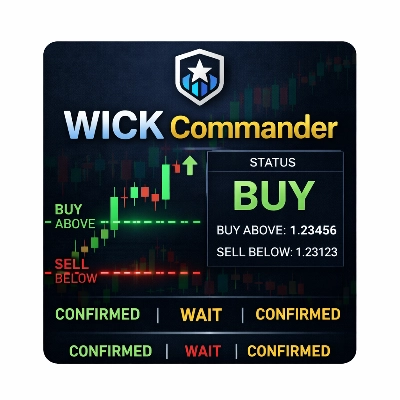
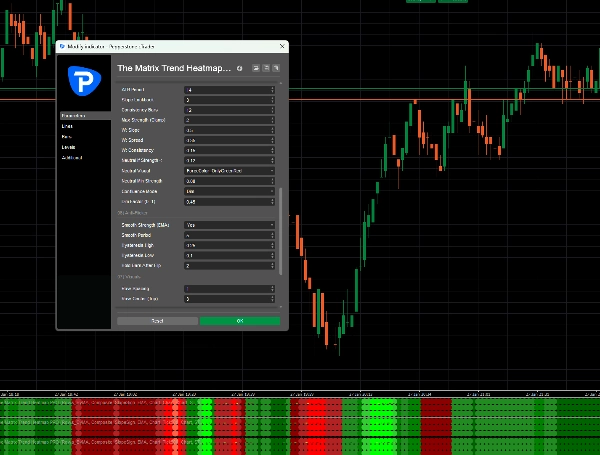
Trading product for Matrix Trend Heatmap PRO 지표 BTCUSD Forex, image 1
Matrix Trend Heatmap PRO
지표
버전 1.0, Jan 2026
Windows, Mac
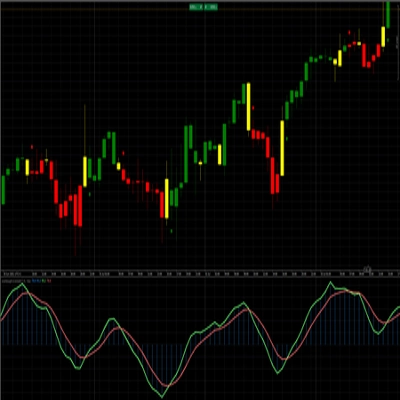
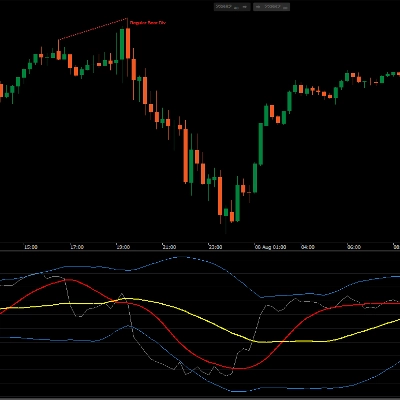
Trading product for Matrix Trend Heatmap PRO 지표 BTCUSD Forex, image 2
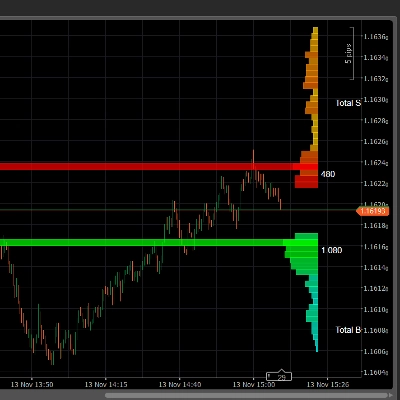
Trading product for Matrix Trend Heatmap PRO 지표 BTCUSD Forex, image 3
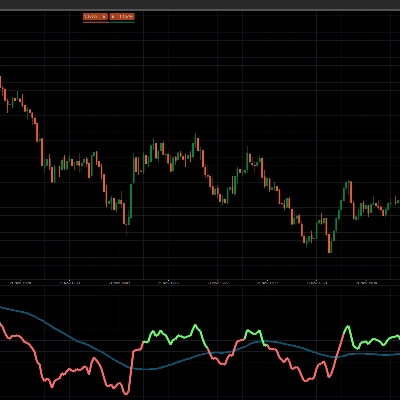
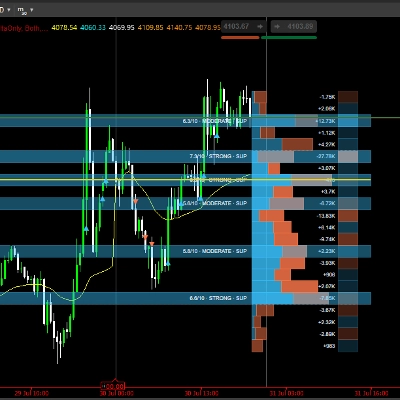
Trading product for Matrix Trend Heatmap PRO 지표 BTCUSD Forex, image 4
86
판매
1.18K
무료 설치

설명

매트릭스 트렌드 히트맵 프로

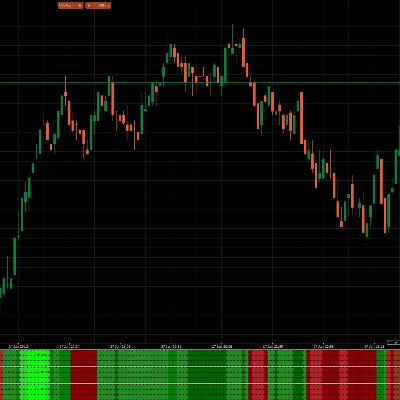
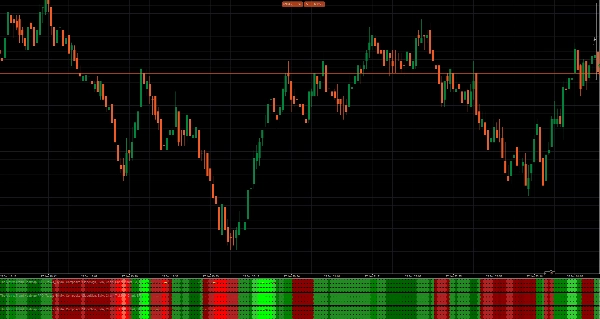
이 지표는 다중 시간대 트렌드 및 강도 엔진으로, 시장이 강세장(녹색), 약세장(빨간색), 또는 중립인지 한눈에 보여주며, 그 방향성 편향이 얼마나 강한지를 나타냅니다.
단일 “트렌드 라인”에 의존하는 대신, EMA 구조 + 기울기 방향 + 변동성(ATR) + 일관성을 하나의 깔끔한 복합 강도 점수로 결합합니다. 결과적으로 빠른 차트에서 특히 방향에 대한 더 부드럽고 신뢰할 수 있는 판독값을 제공하며, 횡보 구간에서 발생하는 잦은 변동을 줄여줍니다.

기본 설정 (틱 30 / 1분)

기본 설정은 틱 30 및 1분 차트에 맞게 특별히 조정된 값입니다. 이 값들은 임의가 아니며, 속도 + 안정성의 균형을 맞추기 위해 완전한 세트로 보정되어, 지표가 실제 트렌드 변화에 빠르게 반응하면서 미세 잡음을 필터링합니다.

기본 하이라이트:

  • MA 유형: EMA
  • 방향 모드: SlopeSign
  • ST / MT / LT 타임프레임: 차트 (정렬된 논리, TF 불일치 없음)
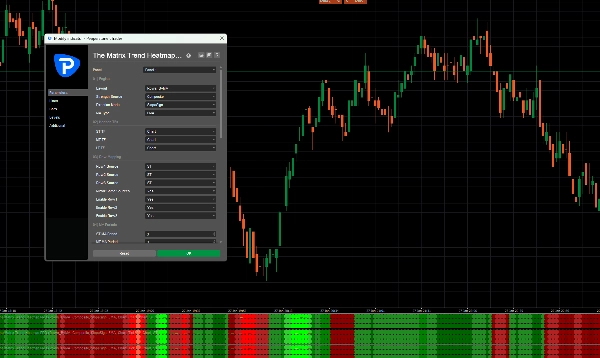
  • ST / MT / LT MA 기간: 3 (빠른 반응, 틱30/1분에 이상적)
  • ATR 기간: 14 (안정적인 변동성 정규화)
  • 기울기 조회 기간: 3 (과도한 깜박임 없이 반응적)
  • 일관성 바: 12 (빠른 차트에서 미세 횡보 필터링)
  • 최대 강도: 2 (시각적 표현을 깔끔하고 통제된 상태로 유지)

복합 가중치 (기본값):

  • W: 기울기 = 0.50 (방향 + 모멘텀이 주요 동인)
  • W: 스프레드 = 0.35 (움직임 “공간/압력” 확인)
  • W: 일관성 = 0.15 (여러 바에 걸친 트렌드 품질)

중립 임계값 (기본값):

  • 강도 < 0.12
    강도가 이 수준 아래로 떨어지면, 지표는 의도적으로 시장을 “우위 없음”으로 간주하여 횡보 구간에서 과도한 거래를 피하도록 도와줍니다.


지표가 하는 일

1) 방향 (SlopeSign)

방향은 선택된 이동평균선(기본값: EMA)의 기울기(각도)에 의해 결정됩니다.

  • 양의 기울기 → 상승 추세 (녹색)
  • 음의 기울기 → 하락 추세 (빨간색)

2) 복합 강도 (단순한 “트렌드 켜기/끄기”가 아님)

색상과 강도는 방향뿐만 아니라 트렌드 강도를 나타냅니다. 강한 트렌드는 더 확고하고 안정적으로 보이며, 약한 트렌드는 중립 쪽으로 희미해집니다.

3) 다중 시간대 프레임워크 (ST / MT / LT)

이 지표는 여러 “시간대”(단기 / 중기 / 장기)를 지원합니다. 조정된 기본값에서는 차트 타임프레임에 매핑되어 틱 30 / 1분 차트에서 일관되고 예측 가능한 동작을 유지합니다.


유용한 이유 (실제 거래 가치)

대부분의 트렌드 지표는 두 가지 방식 중 하나로 실패합니다:

  • 너무 느리다 (확인 지연), 또는
  • 너무 시끄럽다 (횡보 시장에서 잦은 변동).

이 엔진은 다음을 결합하여 이를 해결합니다:

  1. 기울기 (방향 + 모멘텀)
  2. 스프레드 (움직임 압력/공간)
  3. 일관성 (트렌드가 얼마나 깔끔하게 지속되는지)

모두 ATR로 정규화되어, 특히 빠른 차트에서 다양한 변동성 환경에서도 동작이 더 안정적입니다.


사용 방법 (간단하고 효과적)

트렌드 필터 (주요 사용법)

  • 엔진이 녹색일 때만 롱 포지션 설정을 찾으세요.
  • 엔진이 빨간색일 때만 숏 포지션 설정을 찾으세요.
  • 중립 상태에서는 기다리거나 추가 확인과 더 엄격한 목표로만 거래하세요.

진입 타이밍

자신만의 트리거(되돌림, 돌파, 패턴 등)를 사용하되, 지표가 방향성 맥락과 강도를 정의하도록 하세요.

횡보 회피

빈번한 중립/약한 단계 = 횡보/우위 없음.
이는 지표가 자본 보호, 규모 축소 또는 구조를 기다리라는 신호입니다.


안전한 조정 (튜닝을 깨지 않고)

더 차분하게 (덜 민감하게) 만들고 싶다면:

  • 기울기 조회 기간을 3에서 4/5로 늘리세요.
  • 일관성 바를 12에서 14/16으로 늘리세요.

더 빠르게 만들고 싶다면:

  • 기울기 조회 기간은 3으로 유지하고, 중립 임계값만 약간 조정하세요 (예: 0.12 → 0.10) 신중하게).

팁: 한 번에 하나의 매개변수만 변경하세요. 기본값은 균형 잡힌 시스템으로 조정되어 있습니다.


한 줄 요약

빠르고 ATR 정규화된 EMA 기울기 트렌드 엔진으로, 복합 강도 점수(기울기 + 스프레드 + 일관성)를 갖추고 있으며, 틱 30 및 1분 차트에 기본 조정된 노이즈를 줄이고 높은 우위의 트렌드 조건을 강조하도록 설계되었습니다.

요약

AI 요약
Matrix Trend Heatmap PRO is a multi-horizon trend and strength indicator designed for real-time market analysis on Tick 30 and 1-minute charts. It provides an at-a-glance view of market direction—bullish (green), bearish (red), or neutral—along with the strength of the trend. The indicator combines exponential moving average (EMA) slope, volatility (ATR), and trend consistency into a Composite Strength score, offering a smoother and more reliable trend assessment that reduces noise and false signals common in fast or choppy markets.

Key features include:
- Direction determined by EMA slope sign (positive for uptrend, negative for downtrend).
- Composite Strength score integrating slope, spread (movement pressure), and consistency, normalized by ATR for stability across volatility regimes.
- Multi-horizon framework aligned with the chart timeframe for consistent short, mid, and long-term trend evaluation.
- Default settings optimized for speed and stability on fast intraday charts.
- Neutral threshold to identify range-bound or no-edge conditions, helping to avoid overtrading.

Users can apply it as a trend filter by taking long trades when the indicator is green, short trades when red, and exercising caution or waiting during neutral phases. Parameter adjustments allow for tuning sensitivity while maintaining balanced performance.
지표 프로필

상담

고객 리뷰

0.0
리뷰: 0
고객 리뷰
이 상품에 대한 리뷰가 아직 없습니다. 이미 사용해 보셨나요? 다른 사람들에게 가장 먼저 소개해 주세요!

자주 묻는 질문(FAQ)

BTCUSD
Forex
Signal
Breakout
Indices
EURUSD
Commodities
GBPUSD
NZDUSD
Martingale
Prop
Scalping
Supertrend
Fair Value Gap
SMC
Crypto
Grid
Stocks
AI
XAUUSD
NAS100
MACD
USDJPY
트레이딩 봇, 지표, 플러그인 등 cTrader Store에서 제공되는 상품은 제3자 개발자에 의해 제공되며, 이는 단순히 정보 및 기술적 접근을 목적으로 제공된 것입니다. cTrader Store는 중개인이 아니며, 투자 조언, 개인별 추천 또는 향후 성과에 대한 어떠한 보장도 제공하지 않습니다.

이 작성자의 상품 더 보기

지표
AI
ATR
+27
SR Commander is a clean and intelligent support and resistance indicator for cTrader, built to help traders identify key
지표
AI
ATR
+20
Buy and Sell Signals
지표
AI
ATR
+27
WICK COMMANDER — Know Exactly When the Market Commits
지표
AI
ATR
+27
Overbought Oversold Indicator
지표
AI
ATR
+20
Know Sure Thing (KST) momentum engine
지표
AI
SMC
+5
Coloring trendline/ Colored Trendline / Color Trendline
지표
AI
ATR
+27
VWAP Sniper Elite -- Institutional Trend Engine
지표
AI
SMC
+13
Dynamic Liquidity Depth exposes hidden volume
지표
AI
ATR
+26
Entry Momentum MACD Power Guide
지표
AI
ATR
+27
The Professional “All-in-One” Trading Suite (buy and sell indicator)
지표
AI
ATR
+26
SR Commander — Multi Timeframe Edition. See where the big money draws the line. Trade on your timeframe. Think on theirs
"crossover 1" 로고
최고 평점
4.2
(5)
$19
/
$29
지표
AI
Grid
+10
Crossover Buy and Sell Alerts and signals

좋아하실 만한 다른 항목

지표
EMA
Forex
+5
ALMA Smoothed Gaussian Moving Average (ASGMA) – by LudwigICT
지표
XAUUSD
Professional Volume Profile Indicator - Shows volume distribution, POC, Value Areas & Buy/Sell pressure.
지표
Volume
Moving Average
MULTI-TIMEFRAME ROLLING STANDARD DEVIATION TRADING SIGNAL - Smart Volatility Breakout System
지표
Prop
Forex
+5
Visualize trading volume by price within any range, highlight POC and key value areas.
지표
Prop
Forex
+13
🐠 Coral Filter X Pro turns trend detection into a simple, repeatable workflow 🐠
지표
ATR
BOS
+5
Market structure with BOS and CHoCH, order blocks, and retest buy/sell arrows with entry, stop and two targets
지표
Signal
🔹 Trend-Reversal-Indicator for cTrader 🔹 The ultimate Renko chart tool!
지표
Risk Dashboard
AI-powered daily range forecasts help traders spot volatility opportunities and plan stops and targets.
지표
RSI
BTCUSD
+5
Traders Dynamic Index (TDI) — Divergence Edition
지표
Fibonacci
Key Levels
+1
Explore Elliott wave counts, three swing sizes and example levels with an interactive cTrader chart panel.
지표
Pin Bar
Inside Bar
+2
Advanced candlestick pattern recognition with structural quality scoring, alerts and adaptive chart visuals.
지표
VWAP
Volume
+4
Advanced Order Flow & Volume Profiling for cTrader. Unveil institutional footprints, Delta, and Anchored VWAPs.
지표
Aggressive
Supertrend
+5
Stop trading with tunnel vision! 🚫 The Heat Map Dashboard is an institutional-grade visual trading assistant
지표
Area of Interest with the power of AI to detect the market interest.
지표
Forex
Crypto
+4
Auto-detect support and resistance & trendlines, highlight pullbacks/BOS retests, and filter with candle confirmation.
지표
Volume
Key Levels
View tick activity across a selected chart range with Point of Control, Value Area High and Value Area Low.
지표
Volume
Order Block
+3
Map market structure, order blocks, liquidity and key zones with an interactive cTrader dashboard.
지표
BOS
CHOCH
+3
Smart Money Concepts Pro v5.1 for cTrader is a structural market analysis indicator that identifies swings, BOS, CHoC

가격

86
판매
1.18K
무료 설치