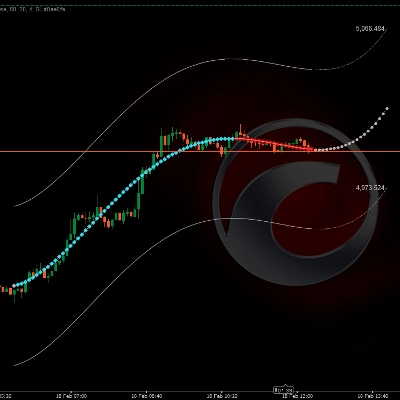
Logo "Polynomial Price Projection Channel"
Indikator
Versi 1.0, Feb 2026
Windows, Mac
4.0
Ulasan: 1
Gambar unggahan "Polynomial Price Projection Channel"
Sejak 03/10/2024
157
Penjualan
36.37K
Instal gratis


๐Ÿ“Š Saluran Proyeksi Harga Polinomial


https://chartshots.spotware.com/c/699603101593d
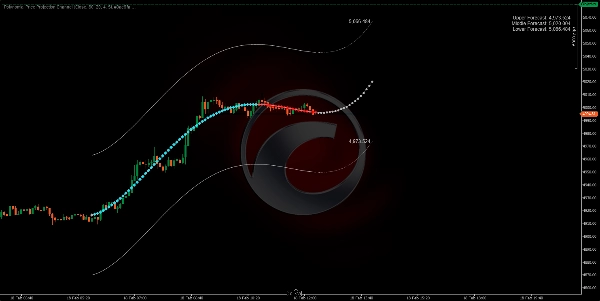
๐Ÿ”Ž APA YANG DILAKUKANNYA? 

https://chartshots.spotware.com/c/69960348da652


Memasang kurva matematis atas penutupan harga N terakhir dan memperluasnya ke masa depan sebagai proyeksi. Di sekitar kurva itu menggambar saluran atas dan bawah yang lebarnya secara otomatis menyesuaikan dengan volatilitas pasar terbaru.
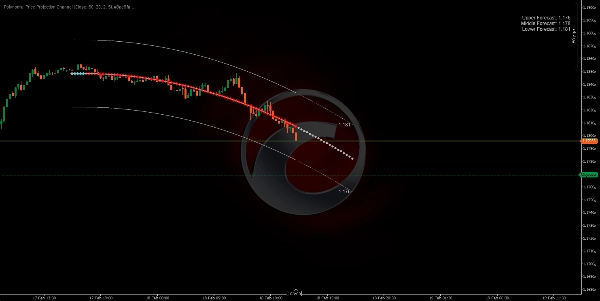
โš™๏ธ BAGAIMANA LOGIKA KERJANYA?

  1. Mengambil N candle terakhir (Lookback Bars) dan menghitung kurva polinomial yang paling sesuai dengan harga-harga tersebut menggunakan metode kuadrat terkecil.
  2. Memperluas kurva ke depan (Forecast Bars) sebagai proyeksi matematis dari tren saat ini.
  3. Membangun saluran dengan menggeser kurva ke atas dan ke bawah menggunakan jangkauan candle maksimum dari periode yang dianalisis ร— 2.


https://chartshots.spotware.com/c/6996039a07e3a

๐Ÿ› ๏ธ PARAMETER UTAMA

Parameter

Default

Tujuan

Lookback Bars

80

Berapa banyak candle historis yang dianalisis

Forecast Bars

20

Berapa banyak candle yang diproyeksikan ke depan

Orde Polinomial

4

Fleksibilitas kurva (lebih tinggi = lebih banyak lekukan)

Input Data

Close

Harga dasar untuk perhitungan
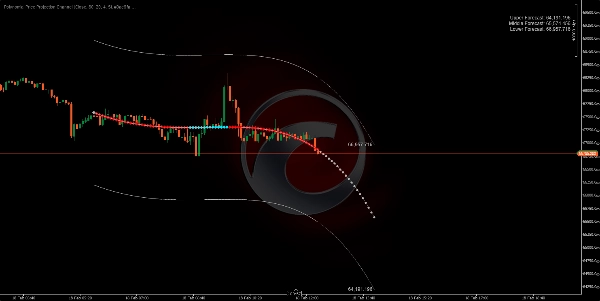

๐ŸŽฏ BAGAIMANA MENGGUNAKANNYA?

๐ŸŸข Potensi Beli โ†’ Harga menyentuh pita bawah dan proyeksi mengarah ke atas.

๐Ÿ”ด Potensi Jual โ†’ Harga menyentuh pita atas dan proyeksi mengarah ke bawah.

โš ๏ธ Selalu konfirmasi dengan faktor lain sebelum berdagang. Indikator ini adalah ekstrapolasi matematis, bukan prediksi yang dijamin.

Profil indikator
4.0
Ulasan: 1
5
0 %
4
100 %
3
0 %
2
0 %
1
0 %
Ulasan pelanggan
February 20, 2026
The reason it feels usable is it gives context without making the decision, and M15 is enough for the first pass.
BTCUSD
Forex
Signal
Indices
EURUSD
Commodities
GBPUSD
NZDUSD
Bollinger
Prop
Crypto
Stocks
AI
XAUUSD
NAS100
ATR
USDJPY
Produk-produk yang tersedia melalui cTrader Store, termasuk bot trading, indikator, dan plugin, disediakan oleh pengembang pihak ketiga serta hanya ditujukan untuk akses teknis dan informasi. cTrader Store bukan broker dan tidak menyediakan saran investasi, rekomendasi pribadi, atau jaminan apa pun tentang kinerja di masa mendatang.

Produk lain dari penulis ini

Logo "ZigZag"
Peringkat teratas
4.3
(6)
Gratis
Indikator
ATR
RSI
+7
ZigZag filters noise, spots trends, patterns, pivots, aiding analysis, trade management, and confirmations. ๐Ÿ“‰๐Ÿ“ˆ
Indikator
ATR
RSI
+7
Identify bullish and bearish Order Blocks to spot key support/resistance levels and potential trend reversals! ๐Ÿ“ˆ๐Ÿ”„
Indikator
ATR
RSI
+7
๐Ÿ“Š Shows volume by price levels, highlights POC, and key zones. Identifies dynamic support/resistance and imbalances.
Indikator
ATR
RSI
+6
Market structural patterns , specifically the concepts of Change of Character (ChoCH) ๐Ÿ”„ and Break of Structure (BoS) ๐Ÿ’ฅ
Indikator
ATR
RSI
+6
Adaptive trend channel using linear regression and Pearson correlation for dynamic support, resistance, and trends.
Indikator
RSI
Breakout
+1
"Identify key market zones and visualize support/resistance from multiple timeframes on a single chart.
Indikator
ATR
RSI
+7
identify and highlight temporary market inefficiencies known as "fair value gaps" ๐Ÿšจ within specific trading Sessions.
Indikator
ATR
RSI
+6
๐Ÿ’น Define a price channel ๐Ÿ“ˆ and determine trend direction (bullish ๐ŸŸข or bearish ๐Ÿ”ด).
Indikator
ATR
RSI
+6
๐Ÿ“ŠZones Supply & Demand: Identifies key price levels with high volume concentration, marking Supply/Demand Zones & Marke
Indikator
RSI
BTCUSD
+5
Identify market structure effortlessly with swing highs, lows, CHoCH, and BOS levels for smart trading decisions! ๐Ÿ“Š๐Ÿ”"
Indikator
ATR
RSI
+8
Detects bullish and bearish divergences
Indikator
Advanced price action toolย that combines multiple technical analysis concepts

Anda mungkin juga suka

Indikator
MSS
Market Structure
NY HTF Candles is a precision panel designed specifically for institutional traders
Indikator
Prop
Forex
+11
๐Ÿ˜ŽRead the description before purchasing๐Ÿ’ฉ
Indikator
ATR
RSI
+8
Multi-timeframe market-state dashboard: Score (-100..+100) + UP/NEUT/DN per TF, with optional closed-candle arrows.
Indikator
EMA
SMA
+3
MACD indicator modeled after TradingView, featuring a 4-color momentum histogram, sound/pop-up crossover alerts.
Indikator
BOS
MSS
+5
WinSMC is an overlay SMC indicator for cTrader. It helps you visually identify!
Indikator
RSI
Indicator Stochastic With RSI
Indikator
ATR
RSI
+6
๐Ÿ’น Define a price channel ๐Ÿ“ˆ and determine trend direction (bullish ๐ŸŸข or bearish ๐Ÿ”ด).
Indikator
Plot higher-timeframe Bollinger Bands for clearer structure, pullback zones, and breakout signalsโ€”without switching char
Indikator
Forex
EURUSD
+3
Forex Strength Meter for cTrader: 4 custom currencies, cross alerts, visual arrows. Trade smarter!
Indikator
Prop
Forex
+2
Vision - Advanced Session Indicator
Indikator
Spread Filter
SpreadSync Entry Timer is a compact cTrader indicator that shows live spread and candle-close.
Indikator
Prop
Forex
+5
Transform your approach to trading with our innovative Pivot Point Indicator.
Indikator
Prop
Forex
+12
โšก ADXVMA Aurora Trend Filter combines ADX trend strength with an adaptive EMA blend โšก
Indikator
VWAP
Volume
+4
Volume Profile + VWAP with Standard Deviations
Indikator
Auto Fibonacci Retracement Indicator for cTrader
Indikator
Forex
EURUSD
+5
Fimathe Indicator - Fimathe PCM - Automated Trend Channels & Levels โ€” Ideal for live trading and backteting
Indikator
Volume
Order Block
+4
Volume Profile with fixed period, custom range and buy/sell pressure.
Logo "Dem"
Peringkat teratas
4.2
(4)
$20
Indikator
Forex
BTCUSD
+5
Scalping indicator for Renko 100 using EMAs to show trend and entry zones with clear colored rectangles.
Sejak 03/10/2024
157
Penjualan
36.37K
Instal gratis