
📊 NILAI HARAPAN VPOC MONTE CARLO
https://chartshots.spotware.com/c/69c558e2c68df
Analisis Pasar Terpadu: Profil Volume + Proyeksi Statistik 🎯
🎯 APA ITU?
Nilai Harapan VPOC Monte Carlo adalah indikator analisis kuantitatif yang menggabungkan dua metodologi trading profesional:
- Profil Kedalaman Pasar (VPOC) - Mengidentifikasi di mana volume benar-benar terkonsentrasi 🏦
- Simulasi Monte Carlo - Memproyeksikan skenario masa depan berdasarkan probabilitas statistik 📈
Hasilnya adalah sistem analisis yang memberi tahu Anda di mana uang berada (Titik Kontrol) dan kemana kemungkinan akan pergi (Nilai Harapan yang diproyeksikan) 🧠
⚙️ BAGAIMANA CARA KERJANYA?
Modul 1: Profil Kedalaman (VPOC) 📊
Indikator menganalisis 200 bar terakhir (dapat dikonfigurasi) dan mendistribusikan volume ke 30 level harga. Ini menghitung:
- Titik Kontrol (PoC): Harga dengan volume perdagangan tertinggi - mewakili konsensus pasar di mana pembeli dan penjual paling aktif ⚖️
- Delta: Perbedaan antara tekanan beli dan jual di setiap level 🔄
- Heatmap: Visualisasi konsentrasi aktivitas 🔥
Logikanya: Harga cenderung kembali ke PoC karena di situlah sebagian besar likuiditas tertunda berada. Jika harga jauh dari PoC, ada probabilitas lebih tinggi untuk kembali 🔄
Modul 2: Proyeksi Statistik (Monte Carlo) 🎲
Menggunakan simulasi stokastik (1.000 iterasi secara default) untuk memproyeksikan harga masa depan:
- Menghitung tren historis aset dan volatilitas tahunan 📉📈
- Menghasilkan jalur acak menggunakan distribusi normal (model gerak Brown geometrik) 🌊
- Memperkirakan Nilai Harapan dengan pita deviasi standar (±1 sigma) 📏
Rumus yang diterapkan: - Drift per bar = Pengembalian tahunan / hari perdagangan 🧮
- Volatilitas per bar = Volatilitas tahunan / √hari ⚡
- Proyeksi = Harga saat ini × e^(total drift + acak normal × total volatilitas) 🔢
Modul 3: Sinergi 🔗
Menggabungkan kedua analisis untuk menghasilkan sinyal kontekstual:
Tabel
Kondisi Sinyal Arti
BULLISH ↑ 🟢 Harga > PoC + Proyeksi positif Tren bullish dikonfirmasi oleh volume
BEARISH ↓ 🔴 Harga < PoC + Proyeksi negatif Tren bearish dikonfirmasi oleh volume
KESEMPATAN ★ 💡 Harga < PoC + Proyeksi positif Kemungkinan pantulan dari dukungan volume
DIVERGENSI ⚠️ ⚠️ Harga > PoC + Proyeksi negatif Peringatan kemungkinan pembalikan
📈 UNTUK APA INI DIGUNAKAN?
✅ Mengidentifikasi level volume kunci - PoC berfungsi sebagai magnet harga 🧲
✅ Memperkirakan probabilitas keberhasilan - Persentase skenario menang dalam simulasi 🏆
✅ Mengevaluasi risiko/imbalan - Rasio Sharpe dan deviasi standar yang diproyeksikan 📊
✅ Mengonfirmasi arah perdagangan - Sinergi antara posisi relatif terhadap PoC dan momentum statistik 🎯
✅ Proyeksi target - Level harga yang diharapkan untuk periode tahan yang ditentukan 🎯
🎮 KONFIGURASI DAN PENGGUNAAN
Parameter Utama:
Tabel
Grup Parameter Default Deskripsi
Periode Analisis Profil Kedalaman 200 bar Riwayat untuk menghitung profil volume
Level Harga 30 Resolusi profil (lebih banyak level = lebih detail) 🔍
Offset Horizontal 5 Posisi profil pada grafik 📏
Durasi Operasi Maks Proyeksi Statistik 252 bar Horizon waktu proyeksi ⏱️
Modal Investasi $1,000 Dasar untuk perhitungan moneter 💰
Simulasi 1,000 Jumlah jalur acak (lebih banyak = lebih akurat, lebih lambat) 🔄
Tingkat Bebas Risiko 5% Untuk perhitungan Rasio Sharpe 📉
Strategi Historis Gunakan TP/SL Tidak Aktifkan untuk simulasi dengan target tetap 🎯
Cara Menginterpretasi Tabel Hasil:
plain
Copy
STATISTIK NILAI HARAPAN
┌──────────────┬─────────┬─────────┬─────────┬────────┐
│ Metode │ $ Jumlah│ % Pengembalian│ Tingkat Menang│ Sharpe │
├──────────────┼─────────┼─────────┼─────────┼────────┤
│ Historis │ -$19.56 │ -1.96% │ 47.2% │ -1.24 │
│ Simulasi │ -$54.05 │ -5.40% │ 21.4% │ -4.95 │
└──────────────┴─────────┴─────────┴─────────┴────────┘
- Historis: Rata-rata kinerja perdagangan serupa di masa lalu 📜
- Simulasi: Hasil rata-rata dari 1.000 simulasi Monte Carlo 🎲
- Tingkat Menang: Persentase skenario dengan hasil positif ✅
- Sharpe: Pengembalian yang disesuaikan dengan risiko (lebih dari 1 bagus, negatif buruk) 📈
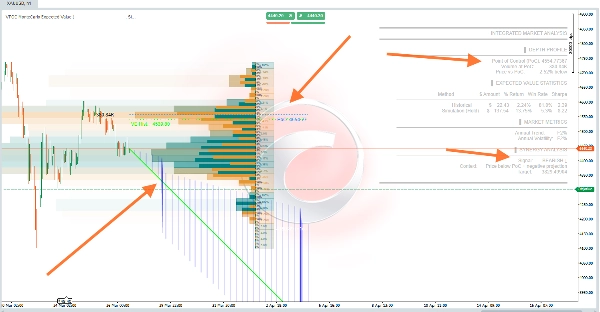
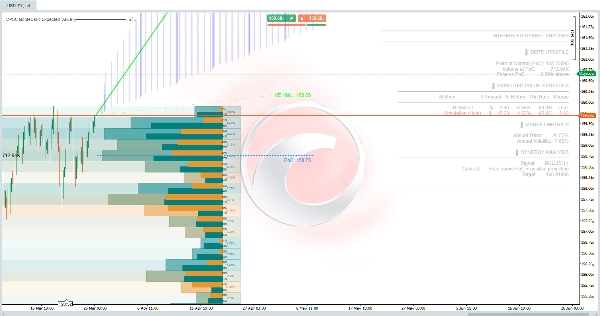
🖼️ Elemen Visual pada Grafik
Tabel
Elemen Warna Arti
Profil volume Gradasi oranye/biru Konsentrasi aktivitas berdasarkan level harga 🎨
Garis PoC Titik-titik biru Titik Kontrol yang diproyeksikan ke masa depan 🔵
Garis proyeksi EV Hijau/Magenta Trajektori harga yang diharapkan 🟢🔴
Pita ±1σ Garis putus-putus putih Rentang kepercayaan 68% 📊
Garis EV historis Garis putus-putus hijau Nilai harapan berdasarkan data historis 🟢
Zona proyeksi Isian biru tembus pandang Area probabilitas antara pita 🔵
⚠️ PENTING - Batasan
- Bukan sinyal beli/jual - Ini adalah alat analisis probabilistik 🛠️
- Simulasi Monte Carlo mengasumsikan distribusi historis berlaku (tidak memprediksi peristiwa angsa hitam) 🦢❌
- PoC bersifat dinamis - Menghitung ulang pada setiap bar baru 🔄
- Memerlukan riwayat yang cukup - Minimal 252 bar untuk proyeksi yang andal 📊
- Cryptocurrency - Indikator secara otomatis menyesuaikan ke 365 hari perdagangan tahunan dibandingkan 252 untuk pasar tradisional 🪙
💡 Strategi Penggunaan yang Direkomendasikan
- Cari KESEMPATAN ★ 💡 - Harga di bawah PoC tetapi dengan proyeksi positif (kemungkinan undervaluasi)
- Konfirmasi dengan Tingkat Menang > 50% - Probabilitas keberhasilan statistik lebih tinggi ✅
- Hindari DIVERGENSI ⚠️ ⚠️ - Harga overvalued relatif terhadap volume aktual
- Gunakan PoC sebagai referensi - Stop atau target di sekitar level likuiditas ini 🎯
- Bandingkan Historis vs Simulasi - Jika sangat berbeda, rezim pasar sedang berubah 🔄


