

Penerangan
Sistem ATR Volatiliti & Trend Lanjutan
Purata Julat Benar (ATR) standard adalah alat yang hebat untuk mengukur volatiliti pasaran, tetapi dalam bentuk lalai, ia hanyalah satu garis tunggal yang sukar dibaca. Ia memberitahu anda jika volatiliti tinggi atau rendah, tetapi ia tidak memberitahu anda bagaimana untuk berdagang dengannya.
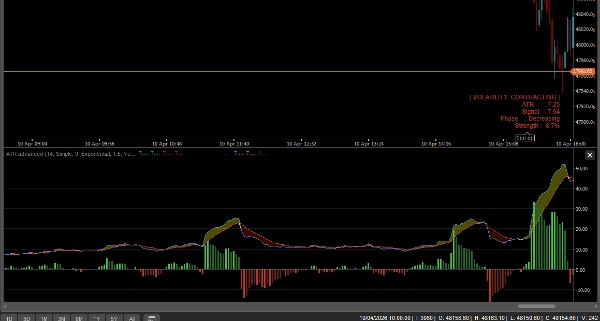
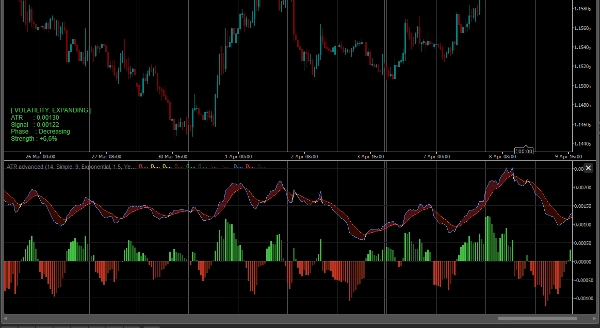
The ATR Lanjutan mengubah metrik asas ini menjadi sistem perdagangan visual lengkap. Dengan memperkenalkan Garis Isyarat Volatiliti, Bar Cat Arah, dan Histogram Momentum, ia memberitahu anda bukan sahaja bila pasaran bergerak, tetapi tepat berapa banyak tenaga di belakang trend semasa.
Ciri Utama VERSI PENUH:
- Awan Pengembangan Volatiliti: Kami menambah Purata Pergerakan (Garis Isyarat) ke ATR. Ruang antara ATR dan Garis Isyaratnya diisi dengan Awan dinamik.
-
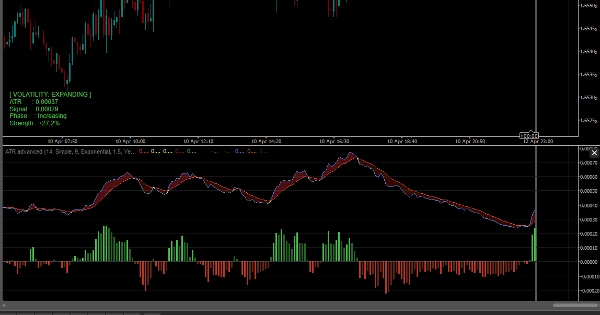
- Awan Hijau (Mengembang): Volatiliti sedang meningkat. Pasaran sedang bangun dan trend adalah kuat.
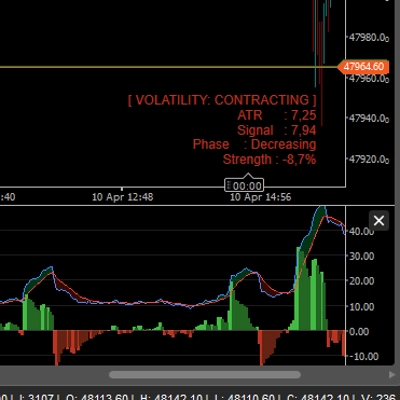
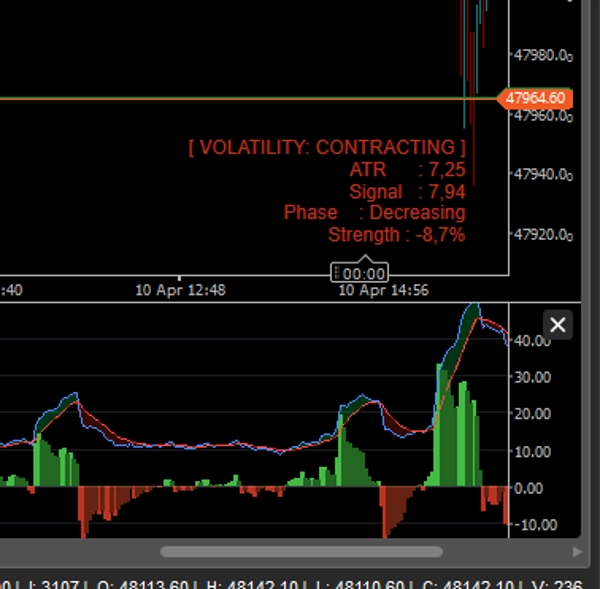
- Awan Merah (Mengecut): Volatiliti sedang menurun. Pasaran sedang mengukuh atau bergerak dalam julat.
- Histogram Momentum: Histogram khusus di bawah mengesan perbezaan tepat antara ATR dan Garis Isyarat, membantu anda mengenal pasti pecahan volatiliti sebelum ia benar-benar berlaku.
- Pewarnaan Bar Pintar (Arah + Volatiliti): Ini adalah ciri utama. Penunjuk membaca kedua-dua arah harga (Bullish/Bearish) DAN keadaan volatiliti, mewarnakan lilin anda mengikutnya:
-
- Hijau/Merah Cerah: Trend Kuat + Volatiliti Mengembang (Sesuai untuk perdagangan pecahan dan trend).
- Hijau/Merah Gelap: Trend Lemah + Volatiliti Mengecut (Amaran: Momentum semakin pudar).
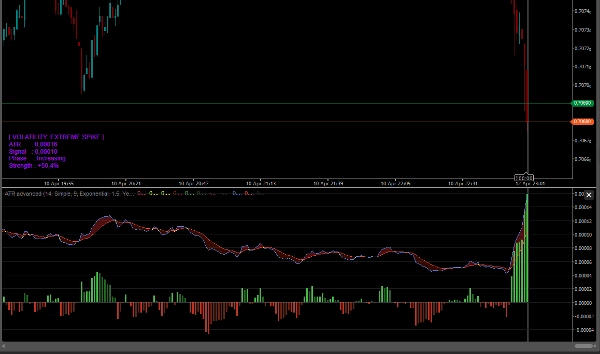
- Pengesanan Volatiliti Ekstrem: Apabila ATR melonjak secara luar biasa tinggi (contohnya, semasa acara berita utama atau puncak blow-off), lilin berubah menjadi Ungu (Ekstrem), memberi amaran tentang kemungkinan kemuncak atau pecahan besar.
- Papan Maklumat Masa Nyata: Panel kemas di carta memaparkan nilai ATR tepat, Fasa Volatiliti (Mengembang/Mengecut), dan bacaan kekuatan peratusan.
- Terbuka Sepenuhnya: Berdagang pada mana-mana simbol (Forex, Crypto, Indeks, Saham) dan mana-mana jangka masa tanpa had. Akses seumur hidup.
Bagaimana untuk berdagang dengannya?
- Pecahan: Elakkan berdagang apabila Awan Volatiliti berwarna Merah (Mengecut). Tunggu ATR melintasi di atas Garis Isyarat (Awan berubah menjadi Hijau) dan lilin anda mewarnakan Hijau Cerah atau Merah Cerah. Ini mengesahkan pecahan sebenar dengan kebarangkalian tinggi.
- Henti Trailing: Kekal dalam perdagangan menang anda selagi Awan Volatiliti kekal Hijau. Apabila ia melintasi ke bawah dan berubah menjadi Merah, ini bermakna momentum telah habis—masa yang baik untuk mengambil keuntungan.
- Amaran Kemuncak: Jika anda berada dalam trend dan lilin tiba-tiba berubah Ungu, berhati-hati! Ini mewakili lonjakan volatiliti ekstrem, yang sering berlaku di akhir trend sebelum pembalikan tajam.
Ringkasan
Ringkasan AI
ATR Advanced is a volatility and trend indicator that enhances the standard Average True Range (ATR) by providing a comprehensive visual trading system. It integrates a Volatility Signal Line (a moving average of ATR) and fills the area between ATR and this line with dynamic Volatility Expansion Clouds. Green clouds indicate expanding volatility and strong trends, while red clouds signal contracting volatility and market consolidation.
Key features include a Momentum Histogram that tracks the difference between ATR and its Signal Line to identify volatility breakouts early, and smart bar coloring that reflects both price direction and volatility state. Bright green/red bars denote strong trends with expanding volatility, dark green/red bars indicate weak trends with contracting volatility, and purple bars warn of extreme volatility spikes often associated with trend climaxes or major events.
The indicator also includes a real-time on-chart dashboard displaying ATR values, volatility phases, and strength percentages. It supports all symbols—including Forex, cryptocurrencies, indices, and stocks—and any timeframe without limitations.
Traders can use it to confirm breakouts when volatility clouds turn green and bars brighten, manage trailing stops by monitoring volatility contraction, and receive warnings of potential trend reversals during extreme volatility spikes.
Key features include a Momentum Histogram that tracks the difference between ATR and its Signal Line to identify volatility breakouts early, and smart bar coloring that reflects both price direction and volatility state. Bright green/red bars denote strong trends with expanding volatility, dark green/red bars indicate weak trends with contracting volatility, and purple bars warn of extreme volatility spikes often associated with trend climaxes or major events.
The indicator also includes a real-time on-chart dashboard displaying ATR values, volatility phases, and strength percentages. It supports all symbols—including Forex, cryptocurrencies, indices, and stocks—and any timeframe without limitations.
Traders can use it to confirm breakouts when volatility clouds turn green and bars brighten, manage trailing stops by monitoring volatility contraction, and receive warnings of potential trend reversals during extreme volatility spikes.
Profil indikator
Kategori indikator
Momentum
Jenis output
Visualisasi
Isyarat
Tapis
Keperluan data
Bar sahaja
Isyarat yang disokong
Kekuatan trend
Kemeruapan
Perbincangan
Ulasan pelanggan
4.3
Ulasan: 3
5 | 33 % | |
4 | 67 % | |
3 | 0 % | |
2 | 0 % | |
1 | 0 % |
Ulasan pelanggan
April 24, 2026
20 signals gives enough for a first read, and the signal gets compared with context.
April 18, 2026
3 percent DD is the line to watch, and the log becomes easier to read.
Soalan Lazim
ATR
Moving Average
Produk yang tersedia melalui cTrader Store, termasuk bot dagangan, indikator dan plugin, disediakan oleh pembangun pihak ketiga dan diberikan akses untuk tujuan maklumat dan teknikal sahaja. cTrader Store bukan broker dan tidak memberikan nasihat pelaburan, syor peribadi atau sebarang jaminan prestasi masa hadapan.






























Harga
32
Jualan
992
Pemasangan percuma