

Deskripsi
# 🚀 Indeks Kinetic Slippage (KSI) – Alat Analisis Tekanan Pasar & Likuiditas Lanjutan
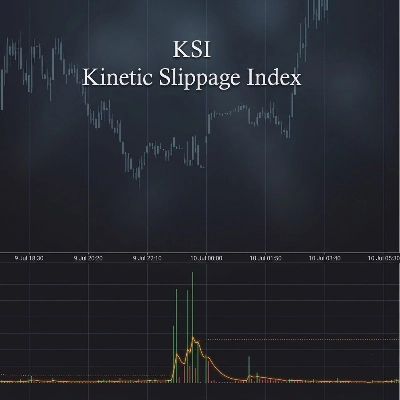
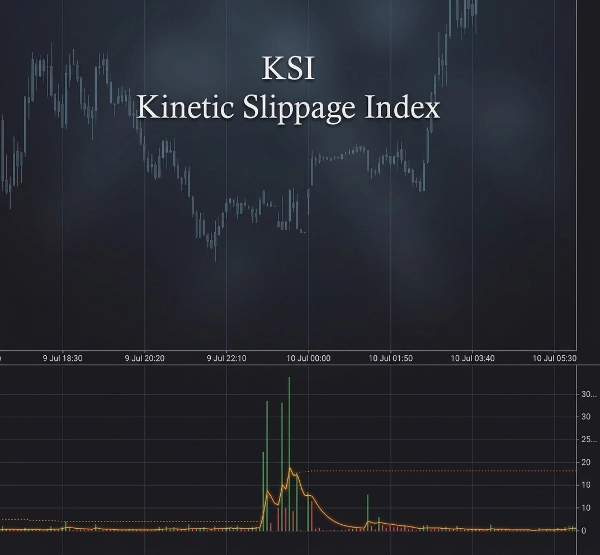
Buka wawasan pasar yang lebih dalam dengan **Indeks Kinetic Slippage (KSI)** — indikator perdagangan yang kuat yang dirancang untuk mengidentifikasi pergerakan harga yang tidak biasa, ketidakseimbangan volume, dan potensi kejadian likuiditas sebelum menjadi jelas di grafik.
Dibuat untuk trader yang menganalisis **struktur pasar, perilaku volume, volatilitas, dan aktivitas institusional**, KSI menggabungkan perluasan rentang dan dinamika volume untuk mengukur kondisi pasar yang abnormal.
## 🔥 Fitur Utama
✅ **Perhitungan Indeks Kinetic Slippage**
* Mengukur hubungan antara pergerakan harga dan volume yang diperdagangkan.
* Mendeteksi situasi di mana harga bergerak secara tidak proporsional dibandingkan dengan perilaku volume normal.
* Membantu mengidentifikasi potensi tekanan likuiditas, aktivitas pasar agresif, dan momentum yang tidak biasa.
✅ **Deteksi Spike Adaptif**
* Secara otomatis menghitung level spike dinamis berdasarkan perilaku pasar terbaru.
* Menggunakan analisis deviasi statistik untuk menyoroti kejadian pasar ekstrem.
* Beradaptasi dengan kondisi volatilitas yang berubah tanpa memerlukan penyesuaian manual terus-menerus.
✅ **Peringatan Spike Real-Time 🚨**
* Terima notifikasi saat terjadi divergensi volume/rentang yang abnormal.
* Membantu trader dengan cepat mengidentifikasi kondisi breakout potensial, pengambilan likuiditas, atau tekanan pasar mendadak.
✅ **Analisis Volume & Aliran 📊**
* Melacak volume saat ini dibandingkan dengan rata-rata EMA-nya.
* Menyoroti saat aktivitas perdagangan sangat tinggi secara tidak biasa.
* Termasuk analisis delta kumulatif untuk memvisualisasikan tekanan beli dan jual.
✅ **Konfirmasi Garis Sinyal 📈**
* Perhitungan sinyal yang halus membantu mengidentifikasi perubahan momentum KSI.
* Visualisasi histogram hijau/merah memudahkan pembacaan pergeseran tekanan pasar.
## 🕒 Intelijen Sesi Perdagangan
KSI menyertakan pelacakan sesi pasar otomatis:
🌏 Sesi Asia
🇬🇧 Sesi London
🇺🇸 New York AM
☕ New York Lunch
🌆 New York PM
Tampilan killzone bawaan membantu trader memahami kapan likuiditas dan volatilitas biasanya lebih tinggi.
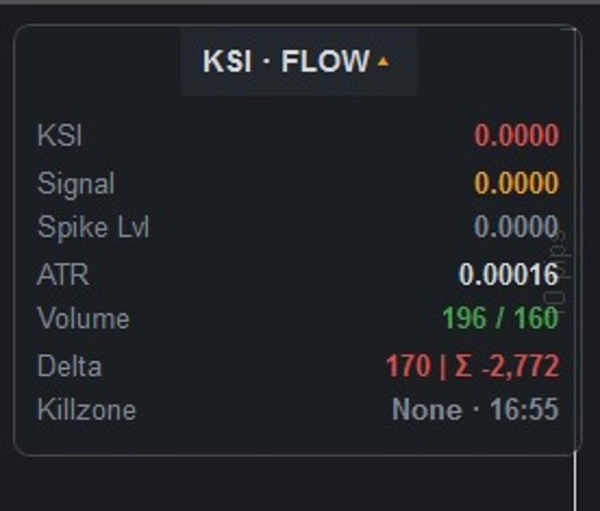
## 📌 Panel Informasi Profesional
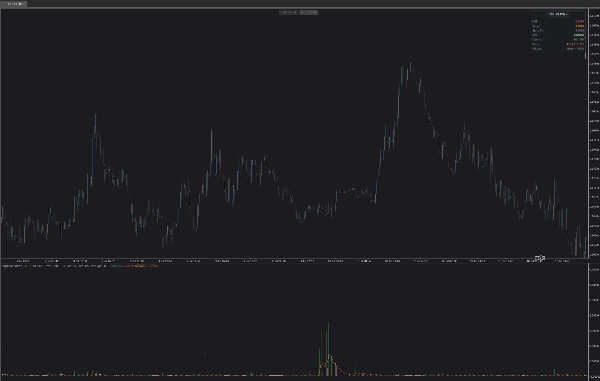
Dashboard terintegrasi menyediakan gambaran bersih langsung di grafik Anda:
📍 Nilai KSI saat ini
📍 Level sinyal
📍 Ambang batas spike adaptif
📍 Pembacaan volatilitas ATR
📍 Volume saat ini vs volume rata-rata
📍 Delta & delta kumulatif
📍 Sesi perdagangan aktif / killzone
Panel dapat:
* ✅ Diposisikan di sudut grafik mana pun
* ✅ Diperluas atau diperkecil
* ✅ Disesuaikan dengan opasitas kustom
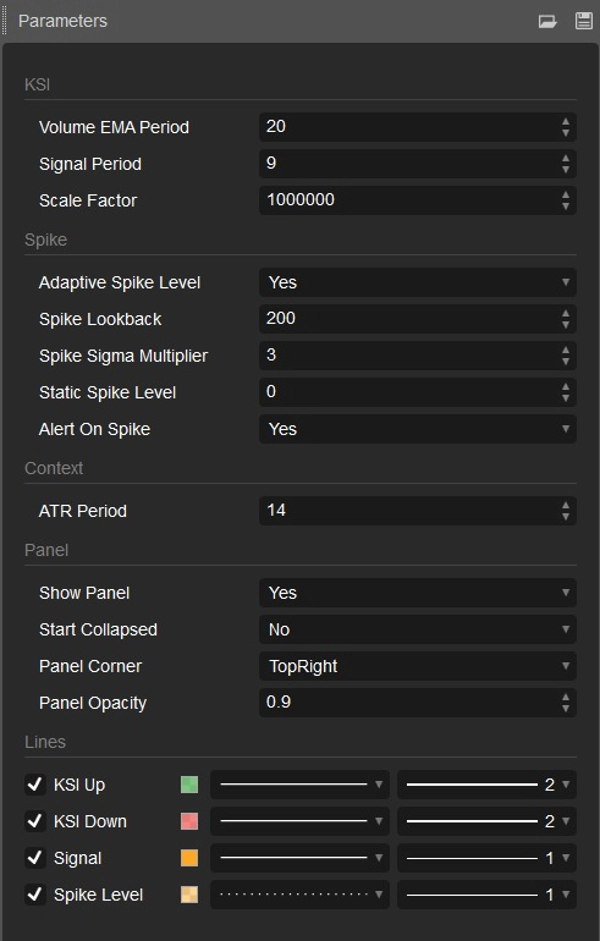
## ⚙️ Pengaturan yang Dapat Disesuaikan
Sesuaikan KSI untuk gaya perdagangan apa pun:
🔧 Periode EMA Volume
🔧 Periode Sinyal
🔧 Faktor Skala
🔧 Deteksi spike adaptif atau tetap
🔧 Periode lookback spike
🔧 Pengali sensitivitas spike
🔧 Periode ATR
🔧 Pengaturan tampilan panel
## 🎯 Dirancang Untuk
✔ Trader Forex
✔ Trader Futures
✔ Trader Crypto
✔ Scalper
✔ Trader harian
✔ Analis struktur pasar
✔ Trader yang mencari konfirmasi berbasis volume
## 💡 Cara Trader Menggunakan KSI
KSI dapat membantu mengidentifikasi:
⚡ Aktivitas pasar yang tidak biasa
⚡ Tekanan breakout potensial
⚡ Divergensi volume-harga
⚡ Kejadian likuiditas
⚡ Perubahan momentum
⚡ Peluang perdagangan dengan volatilitas tinggi
Gabungkan KSI dengan strategi Anda yang sudah ada untuk mendapatkan pandangan yang lebih jelas tentang **kapan pasar bergerak normal — dan kapan sesuatu yang tidak biasa sedang terjadi.**
📈 Berdagang dengan lebih cerdas. Pahami tekanan pasar. Deteksi aktivitas tersembunyi dengan Indeks Kinetic Slippage.
Ringkasan
The indicator includes volume and flow analysis by comparing current volume to its exponential moving average (EMA) and incorporates cumulative delta analysis to visualize buying and selling pressure. A smooth signal line and histogram help confirm changes in KSI momentum, making shifts in market pressure easier to interpret.
KSI tracks major trading sessions—Asia, London, and New York (AM, Lunch, PM)—highlighting periods of higher liquidity and volatility. A professional information panel displays key metrics such as current KSI value, signal level, adaptive spike threshold, ATR volatility, volume comparisons, delta values, and active trading sessions. This panel is customizable in position, size, and opacity.
Settings allow fine-tuning of volume EMA period, signal period, scale factor, spike detection parameters, ATR period, and panel appearance. KSI is suitable for forex, futures, and crypto traders, including scalpers, day traders, and market structure analysts seeking volume-based confirmation and insights into unusual market activity, breakout pressure, liquidity events, and momentum changes.
Diskusi
Ulasan pelanggan
5 | 0 % | |
4 | 100 % | |
3 | 0 % | |
2 | 0 % | |
1 | 0 % |
Pertanyaan umum
Produk lain dari penulis ini


















Harga