present
新規登録で初回購入時に$50オフ
Trading product for LondonOpenSignal インジケーター EMA AI-assisted, image 1
LondonOpenSignal
インジケーター
バージョン 1.0、Aug 2026
Windows、Mac
Trading product for LondonOpenSignal インジケーター EMA AI-assisted, image 2
Trading product for LondonOpenSignal インジケーター EMA AI-assisted, image 3
Trading product for LondonOpenSignal インジケーター EMA AI-assisted, image 4
Trading product for LondonOpenSignal インジケーター EMA AI-assisted, image 5
登録日 03/03/2026

説明

What market data it analyses

London Open Signal loads years of the attached symbol's intraday history directly from your broker (M15 or H1 resolution, your choice) and reconstructs every past trading day into two windows: a full "day" range (configurable start/end hour) and the London session itself (configurable open/close hour, in broker server time). For each historical session it simulates two hypothetical trades — a long and a short — using a fixed stop and target, exiting at session close if neither is hit, net of an allowance for spread and costs. It then tests five simple ideas against those outcomes to see which, if any, actually predicted the result: the current overnight win/loss streak, day of the week, where the session's opening price sits inside the previous day's range, the gap versus the previous day's close, and whether the previous day's range was unusually wide or narrow.

How to interpret the signals and visual elements

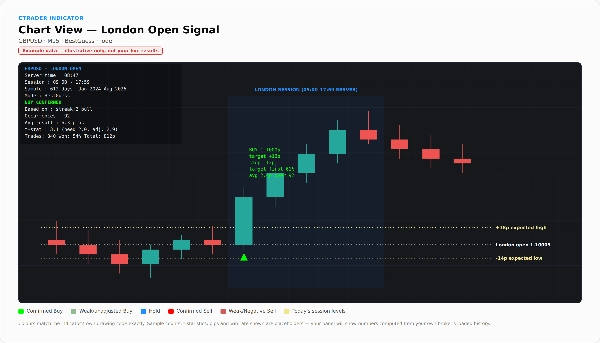
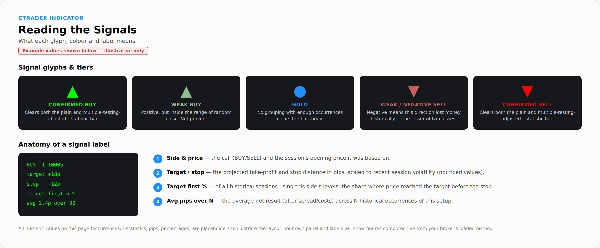
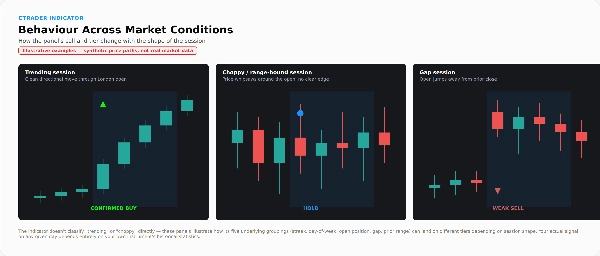
A green up arrow marks a Buy call at that day's London open; a red down arrow marks Sell; a blue dot marks Hold (no defensible edge found). These historical arrows are computed walk-forward — each one uses only the data that would have been available before that day, never the outcome of the day itself.

The on-chart panel (top-left) shows today's call and a tier label: CONFIRMED, CONFIRMED (unadjusted), WEAK, or NEGATIVE. This tells you how much to trust the arrow — WEAK means the apparent edge is within the range of random noise, and NEGATIVE means that direction has actually lost money historically and the arrow is only the lesser of two losses. The panel also shows which grouping the call is based on, how many times it's occurred, the average result, the t-statistic against both the plain and multiple-testing-adjusted thresholds, and — most importantly — a running walk-forward scoreboard: how many trades the tool would actually have taken, win rate, total pips, pips per trade, and worst drawdown. If that running total is flat or negative, the panel says so directly.

Three optional overlays add detail: a full results table (every grouping tested, with sample size and t-statistic for both directions), a "stop/target lab" that shows how win rate changes purely from where you place the stop and target — to make the point that a high win rate isn't the same as a real edge — and a session-levels box showing the typical size of the London session's up-move, down-move, and total range at the median/75th/90th percentile. Dotted lines on today's session mark the open and the volatility-scaled expected high/low.

Key settings and parameters

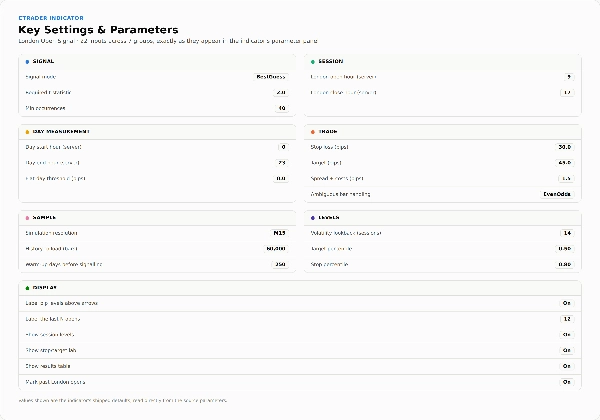
  • Signal: Mode (Confirmed Only vs Best Guess), Required t-statistic, Minimum occurrences before a grouping counts
  • Session: London open hour, London close hour (broker server time)
  • Day measurement: Day start/end hour, flat-day threshold (pips)
  • Trade: Stop loss (pips), Target (pips), Spread/costs allowance (pips), Ambiguous-bar handling (Pessimistic / Even odds / Optimistic, for bars that touch both stop and target)
  • Sample: Simulation resolution (H1/M15), History to load (bars), Warm-up days before the tool starts signalling
  • Levels: Volatility lookback (sessions), Target percentile, Stop percentile
  • Display: Label arrows / label count, show session levels, show stop-target lab, show results table, mark past London opens

Typical use cases and trading scenarios

Checking the panel before the London open for the current call, its tier, and the expected session range for the day. Researching whether any simple, interpretable pattern has held up statistically for a given pair over its own history — and seeing honestly whether that pattern survives correction for having tested several ideas at once. Using the session-level projections (expected high/low) for planning targets or stops independently of the buy/sell call itself. It is not designed for unattended automated execution — it's an indicator, not a cBot, and never places a trade itself.

Who this is best suited for

Traders who want to see the actual, walk-forward-verified track record behind a signal rather than take a claim on faith, and who are comfortable reading a t-statistic and a drawdown number alongside an arrow. Discretionary London-session traders who value the session-range context even when they choose to ignore the buy/sell call. It is deliberately not built for someone looking for a plug-and-play "just follow the arrow" system — the tool grades its own signals and will tell you outright when the numbers don't support trading them.

Important limitations and usage notes

  • Performance is computed live from whatever broker history is actually loaded when the indicator runs — it is not a fixed, pre-generated backtest file, so results can vary by broker/account and will need enough loaded history (increase "History to load" if the panel reports not enough data).
  • The multiple-testing adjustment is a heuristic, not a guarantee — an adjusted threshold reduces, but doesn't eliminate, the chance a result looks meaningful by luck alone.
  • The five ideas tested are simple, single-factor classifiers, checked independently rather than combined — a deliberate choice to keep the tool interpretable and avoid compounding the overfitting risk further.
  • In Best Guess mode the indicator always shows a direction, including NEGATIVE-tier calls — always read the tier label, not just the arrow.
  • Simulated stop/target fills use a simplified assumption for bars that touch both levels in the same candle; real execution may differ.
  • Purely price/statistics-based — no news, fundamental, or cross-asset input.
  • Visual and analytical only; it does not place trades.

概要

インジケーターのプロフィール
インジケーターのカテゴリー
ボラティリティ
出力の種類
ビジュアル表示
シグナル
データ要件
バーのみ
サポート対象のシグナル
セッション開始レンジ

カスタマーレビュー

0.0
レビュー: 0
カスタマーレビュー
この商品にはまだレビューがありません。お使いになったことがある方は、ぜひレビューをお願いします。

ディスカッション

よくあるご質問

EMA
AI-assisted
Volume
Support & Resistance
cTrader Storeで入手可能な取引ボット、インジケーター、プラグインなどの商品は、第三者の開発者が提供するものであり、情報と技術の取得のみを目的としてご利用いただけます。cTrader Storeはブローカーではなく、投資助言や個人的な推奨を行うことも、将来のパフォーマンスを保証することもありません。

この作成者の他の商品

cBot
EMA
SL Manager
+5
Automated London-open breakout cBot for GBPUSD H1, with trend filter and breakeven management.
1.03
プロフィットファクター

これも好きかも

インジケーター
Volume
Key Levels
+1
Order book indicator .Don't trade against the flow. Trade with the truth!
インジケーター
ATR
RSI
+5
One of the best indicators we have ever developed, with a very high profit ratio.
インジケーター
ATR
RSI
+2
This indicator works best as a trend-confirmation tool—wait for multiple signals!
インジケーター
Support & Resistance
Detects Gartley, Bat, Butterfly, Crab, Shark & Cypher patterns and backtests each one's real win rate.
インジケーター
Prop
Forex
+13
⚔️Full breakout trading workstation: session box, EP/TP/SL levels, on-chart ✓/✗ outcomes, pro-level analytics and more⚔️
インジケーター
Prop
Forex
+11
🧭 See when your market tends to move—by Month, Day-of-Week, or Hour-of-Day🧭
インジケーター
ATR
Fibonacci
+1
Trading Clock Pro: An all-in-one market timing dashboard designed to help traders understand the market at one Spot.
「PivotLevels」ロゴ
トップ評価
4.7
(4)
$25
/
$30
インジケーター
Prop
Forex
+4
It draws Pivot Levels on the chart.
インジケーター
Forex
BTCUSD
+5
Auto-plots Open, High, and Low of Day/Week/Month/Year. Session candle counter + Round Numbers. Fully customizable
インジケーター
BOS
CHOCH
+5
Advanced SMC indicator with multi-timeframe bias, peak killzones & institutional order blocks.
インジケーター
SMC
Prop
+12
Multi-TF FVG + Smart Fibonacci
インジケーター
Prop
Forex
+5
Visualize trading volume by price within any range, highlight POC and key value areas.
インジケーター
SMC
VWAP
+5
Smart ICT Concepts indicator from TV: combining FVGs, Liquidity, Order Blocks, and Market Structure in one tool.
インジケーター
ATR
EMA
+2
Dense EMA rainbow + Pro tools & a tested engine — get more from your EMAs, your research base for EMA bots.
インジケーター
SMC
Forex
+15
Smart institutional order block & FVG scanner with alerts, zone merging, and HTF confluence.
インジケーター
BOS
Order Block
+3
Not every order block deserves your attention.
インジケーター
RSI
VWAP
+5
📈 Anchored VWAP with auto High/Low, session resets, Daily VWAP & TWAP — precise, Pine-accurate port.
インジケーター
ATR
Prop
+5
Anchor volume profiles to pivots with POC, VAH, VAL and real-time insights for clearer trade decisions.

価格

登録日 03/03/2026