Deskripsi
Ikhtisar Indikator
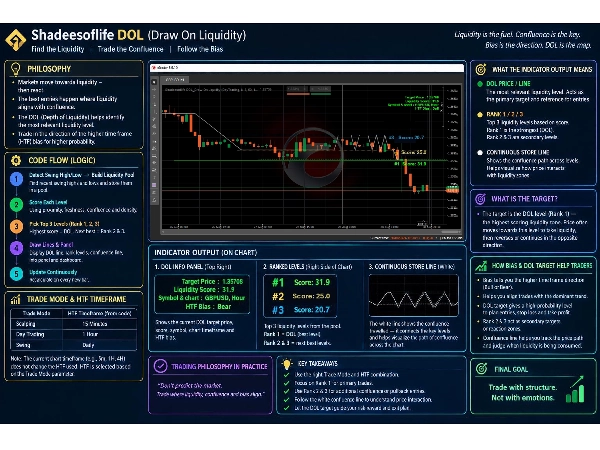
Indikator Shadeesoflife DOL (Draw on Liquidity) c Trader memberikan mesin identifikasi target dinamis berdasarkan Konsep Uang Pintar (SMC) dan prinsip ICT. Ini secara otomatis menggambar Garis pada Likuiditas (DOL), mengurutkan, dan melacak kumpulan likuiditas struktural-"Konfluensi tinggi" di seluruh pasar pada setiap tick. DOL adalah target dinamis, likuiditas konfluensi tinggi.
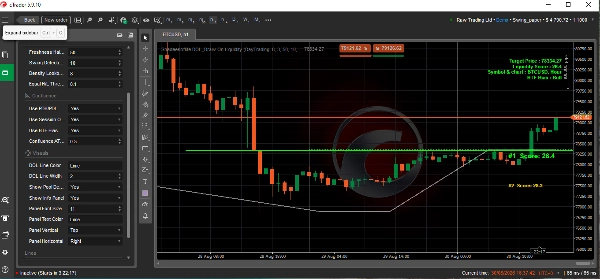
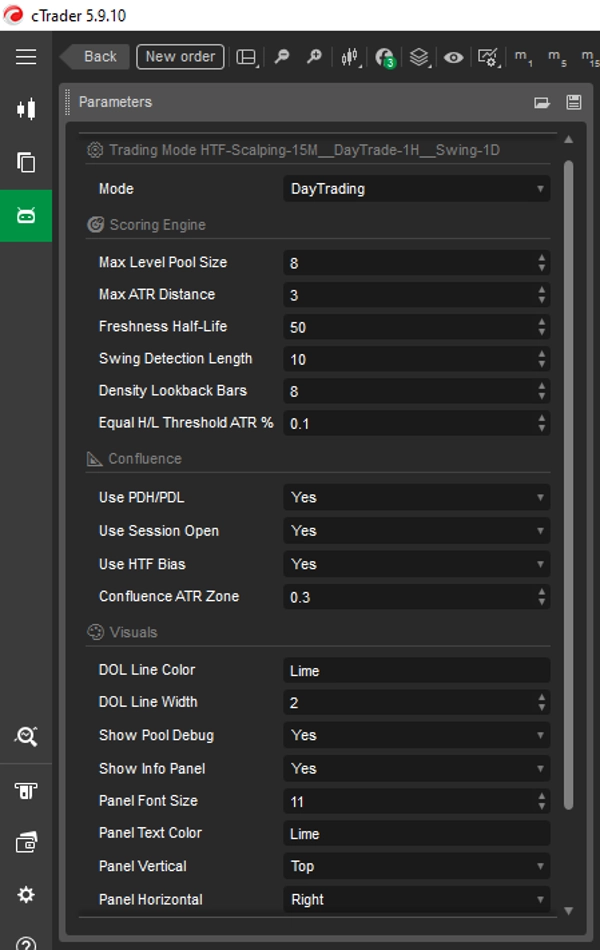
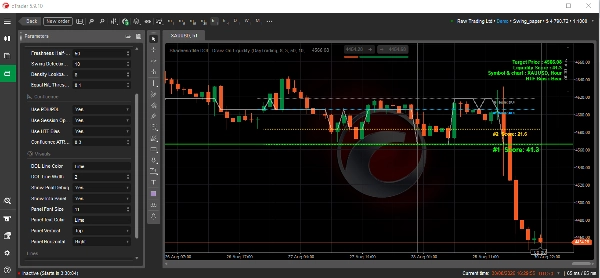
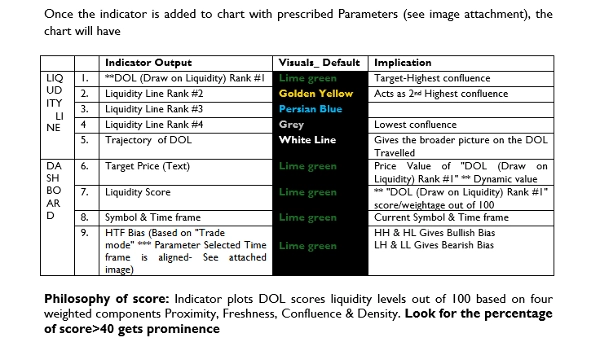
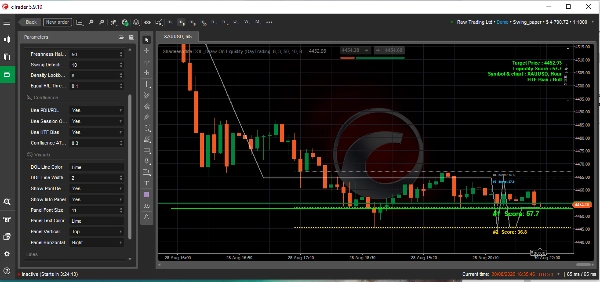
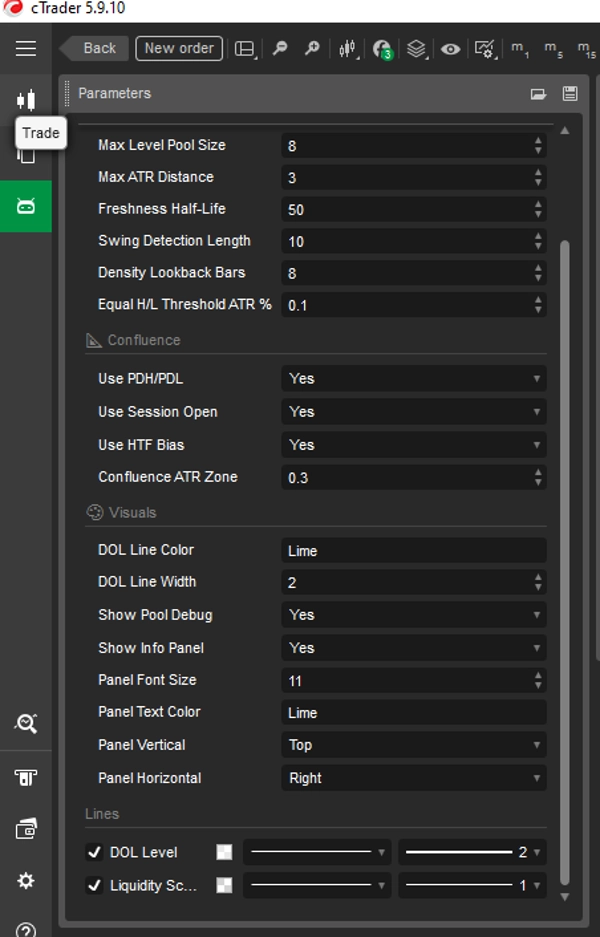
Indikator menghasilkan Target DOL utama (level dengan skor tertinggi, ditampilkan sebagai garis menonjol) bersama dengan kumpulan target likuiditas sekunder yang diurutkan, sambil menyediakan panel di layar yang menunjukkan bias HTF saat ini dan metrik target. Setelah indikator ditambahkan ke grafik dengan Parameter yang ditentukan (lihat lampiran gambar), grafik akan memiliki
Untuk Jawaban- Lihat gambar terlampir (Tabel).
Filosofi skor: Indikator memetakan skor DOL level likuiditas dari 100 berdasarkan empat komponen berbobot Kedekatan, Kesegaran, Konfluensi & Kepadatan.
FAQ
1.Bagaimana cara kerjanya- Kerangka Strategi Multi-Timeframe HTF & LTF??
Mengidentifikasi Bias dan Arah Timeframe Lebih Tinggi (HTF)
Indikator menentukan bias struktural menggunakan pilihan Mode Perdagangan yang mendasari untuk merujuk ke timeframe yang lebih tinggi (misalnya, ***Harian untuk Swing, 1-Jam untuk Day Trading, 15-Menit untuk Scalping):
- Bias HTF Bullish:
- Kondisi: Lilin HTF ditutup lebih tinggi dari pembukaannya (HTF Bullish).
- Perilaku Indikator: Mesin penilaian menunjukkan Harga Target (garis bertanda skor #1) berada di bawah harga Ask/bid (target HTF menunjukkan likuiditas internal dan harga target LTF menunjukkan likuiditas eksternal).
- Implikasi Perdagangan: Harga mencari likuiditas sisi jual (SSL) di bawah untuk retracement diskon sebelum melanjutkan ke atas, atau menargetkan likuiditas sisi beli (BSL) di atas sebagai target ekspansi utama.
- Bias HTF Bearish:
- Kondisi: Lilin HTF ditutup lebih rendah dari pembukaannya (HTF Bear).
- Perilaku Indikator: Mesin penilaian menunjukkan Harga Target (garis bertanda skor #1) berada di atas harga Ask/bid (target HTF menunjukkan likuiditas internal dan harga target LTF menunjukkan likuiditas eksternal).
- Implikasi Perdagangan: Harga mencari likuiditas sisi beli (BSL) di atas untuk retracement premium sebelum bergerak ke bawah, atau menargetkan likuiditas sisi jual (SSL) di bawah.
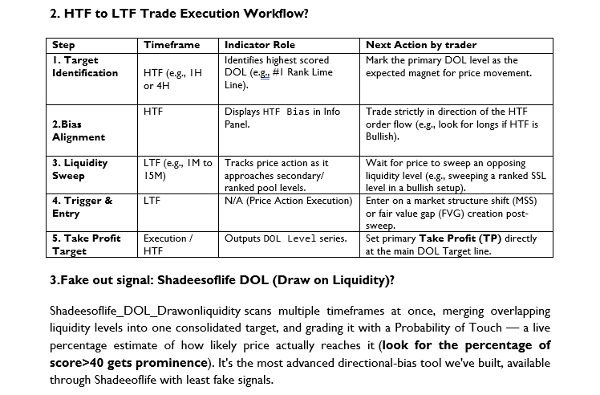
2. Alur Kerja Eksekusi Perdagangan dari HTF ke LTF?
Untuk Jawaban- Lihat gambar terlampir (Tabel).
3.Sinyal Palsu: Shadeesoflife DOL (Draw on Liquidity)?
"Shadeesoflife DOL Draw on liquidity" memindai beberapa timeframe sekaligus, menggabungkan level likuiditas yang tumpang tindih menjadi satu target terkonsolidasi, dan menilainya dengan Probabilitas Sentuhan — perkiraan persentase langsung seberapa besar kemungkinan harga benar-benar mencapainya (perhatikan persentase skor>40 mendapatkan penonjolan). Ini adalah alat bias arah paling canggih yang kami buat, tersedia melalui Shadeeoflife dengan sinyal palsu paling sedikit.
4. Bagaimana Konfluensi dalam "Shadeesoflife DOL Draw on liquidity" bekerja secara teknis ?
"Shadeesoflife DOL Draw on liquidity" memindai Likuiditas Internal, Likuiditas Eksternal, Order Blocks, Breaker Blocks, FVGs, iFVGs, dan BSL/SSL untuk bias arahannya. DOL Pro berjalan pada mesin yang benar-benar berbeda — memindai EQH/EQL, FVG besar, batas sesi, PDH/PDL, dan celah malam/minggu di berbagai timeframe, membaca bias sesi seperti ayunan Judas dan kelanjutan, serta menilai targetnya dengan Probabilitas Sentuhan langsung, dengan algoritma yang jauh lebih cerdas. Misi bias arah yang sama seperti DOL, dibangun pada mesin yang lebih ketat. Memberikan hasil setup probabilitas tinggi dengan menyediakan Arah dan target Konfluensi Lebih Tinggi harga.
Membaca beberapa timeframe sekali waktu, bukan hanya satu, Memindai EQH/EQL, FVG besar, batas sesi, PDH/PDL, dan celah malam/minggu. Membaca bias sesi — pola seperti ayunan Judas dan kelanjutan.
┌──────────────────────────────────────┐
│ KONSEP ICT / LIKUIDITAS │
│ DOL • PDH • PDL • Sesi • HTF │
│ Likuiditas • Tinggi/Sedang Sama │
└──────────────────┬───────────────────┘
↓
┌──────────────────────────────────────┐
│ LAYER SMC / STRUKTUR │
│ Swing High • Swing Low │
│ Kolam Likuiditas • Arah HTF │
└──────────────────┬───────────────────┘
↓
┌─────────────────────────────────────────┐
│ MESIN KUANT SHADEESOFLIFE │
│ Kedekatan X% + Kesegaran Y% + Konfluensi Z% + Kepadatan A% │
│ │
│ → Skor 0–100 → Peringkat #1/#2/#3 → DOL Dinamis │
└─────────────────────────────────────────┘
📊Rincian Grafik Teknis (Interpretasi Gambar terlampir)
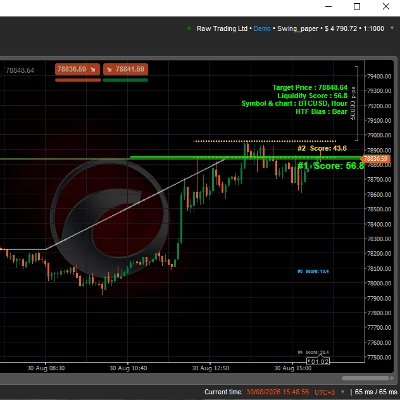
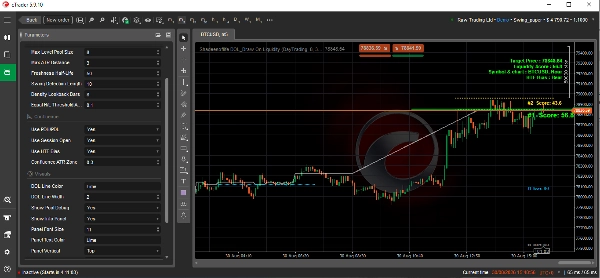
Grafik ini dari Platform Perdagangan cTrader menampilkan BTCUSD (Bitcoin / Dolar AS) pada horizon waktu 5-menit (m5) . Ini menampilkan indikator struktur pasar otomatis khusus yang disebut "Shadeesoflife DOL Draw On Liquidity", yang dikonfigurasi menggunakan Konsep Uang Pintar (SMC).
🔎 Metrik & Analisis Teknis Utama
- Harga Saat Ini: Aset diperdagangkan pada 78,856.48, bergerak ketat dalam rentang likuiditas tinggi yang sangat sempit.
- Harga Target / Draw on Liquidity (DOL): Ditandai oleh garis horizontal hijau terang padat pada 78,848.64. Ini berfungsi sebagai magnet menonjol untuk aksi harga.
- Skor Likuiditas (57.3): Skor sedang menunjukkan order institusional yang stabil tetapi tidak berlebihan di sekitar kantong ini.
- Bias Timeframe Lebih Tinggi (HTF): Secara eksplisit diberi label Bearish (Bear). Sistem mencari kelanjutan ke bawah setelah likuiditas beli yang sedang istirahat dibersihkan.
- Skor Prioritas Algoritmik:
- Skor #1 (57.3): Terletak tepat di garis target hijau.
- Skor #2 (45.8): Istirahat sedikit lebih tinggi di level garis dasar merah.
💡 Interpretasi Strategis Inti
Indikator memetakan setup SMC klasik di mana mesin pasar mencari untuk menyapu kumpulan institusional tertentu.
- Efek Magnet: Harga telah terdorong ke zona premium dan sekarang sangat tertarik ke garis dasar hijau Draw on Liquidity (DOL) pada 78,848.64.
- Penyesuaian Tren: Karena Bias HTF struktural adalah Bearish, tarikan lokal ke bawah ke garis DOL ini sangat sesuai dengan tren dominan.
- Pembersihan Likuiditas: Setelah harga menargetkan dan mengurangi likuiditas yang sedang istirahat di garis hijau ini, trader biasanya mengamati untuk terobosan struktural yang menentukan atau kelanjutan agresif dari arah bearish makro.
Catatan:
- Dapat digunakan di BTCUSD, XAUUSD, GBPUSD atau simbol apa pun.
- Analisis BTCUSD di atas didasarkan pada grafik LTF 5m (pemilihan manual grafik) dan HTF 1HARI (Parameter “Mode Perdagangan” untuk perdagangan Harian dari pilihan Drop down).
- Indikator dapat digunakan untuk(pemilihan parameter “Mode Perdagangan” sesuai time frame untuk BIAS*)
- Scalping- HTF 15M, (Default)
- Perdagangan Harian- HTF 1J,
- Perdagangan Swing- HTF 1H,
- Perdagangan Empat Jam- HTF 4J
- Parameter "Tampilkan debug pool" dapat digunakan untuk mematikan garis konfluensi Target yang kurang penting kecuali peringkat #1.
- Parameter "Tampilkan panel info" dapat digunakan untuk mematikan untuk menyembunyikan panel.
- "Panel" dapat disesuaikan dengan ukuran teks, warna teks & posisi panel (Posisi horizontal/Vertikal).
- Posisi garis "level DOL" pada koordinat sumbu X (Harga) menunjukkan garis konfluensi Target Peringkat #1 pada koordinat sumbu Y masing-masing (Waktu).
Ringkasan
The indicator outputs a primary Draw on Liquidity (DOL) target line representing the highest-scored liquidity level, along with secondary ranked targets. It provides an on-screen panel displaying higher timeframe (HTF) bias and target metrics, supporting trading styles from scalping to swing trading by referencing appropriate HTFs (e.g., 15-minute for scalping, daily for swing).
Shadeesoflife DOL integrates multi-timeframe analysis, scanning equal highs/lows, fair value gaps, session boundaries, previous day highs/lows, and gaps to assess directional bias and price magnet levels. It calculates a live Probability of Touch (PoT) percentage estimating the likelihood of price reaching each target.
Traders use the indicator to align trades with HTF bias, identify liquidity sweeps on lower timeframes, and set entries and take profit targets at ranked liquidity pools. It supports markets including BTCUSD and XAUUSD and offers customizable display options for target lines and info panels.





![Logo "[Stellar Strategies] Smart ADX"](https://cdn.ctrader.com/image/webp/af13b084-b6f6-41db-b7bc-c7e688b57b05_36929)