
설명
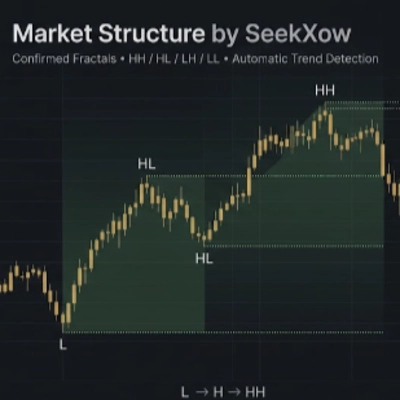
확인된 프랙탈 피벗을 사용하여 시장 구조를 식별하고 시각화하도록 설계된 가격 행동 지표입니다. 이 지표는 스윙 고점과 저점을 추적하고 다음과 같이 분류합니다:
- HH — Higher High
- HL — Higher Low
- LH — Lower High
- LL — Lower Low
확인된 프랙탈 피벗을 사용하여 노이즈를 줄이고 확인되지 않은 가격 변동에 의존하는 것을 피합니다. 동일 유형의 연속 피벗은 압축되어 관련 극값이 유지된 후 시장 구조가 평가됩니다.
주요 특징
- 확인된 프랙탈 기반 스윙 감지
- 자동 HH / HL / LH / LL 분류
- 강세 및 약세 시장 구조 감지
- 자동 추세 상태 식별
- 시각적 수평 구조 레벨
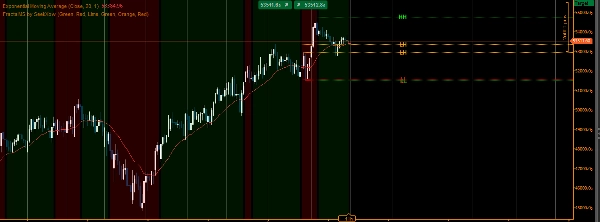
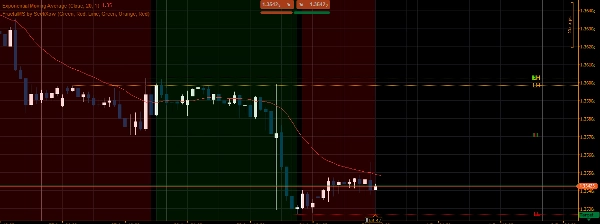
- 추세 배경 시각화
- 새로운 확인된 피벗이 개발됨에 따라 구조가 적응
- 재량적 가격 행동 및 시장 구조 분석을 위해 설계됨
작동 원리
이 지표는 먼저 확인된 스윙 고점과 저점을 감지합니다. 그런 다음 이 피벗들은 고점과 저점이 교대로 나타나는 순서로 처리됩니다. 결과 피벗 순서는 현재 시장 구조와 추세를 결정하는 데 사용됩니다. 상승 추세 동안 새로운 고점은 Higher Highs를 형성할 수 있으며, 관련 조정 저점은 Higher Low가 됩니다. 하락 추세에서는 반대 논리가 적용됩니다. 관련 구조적 레벨의 돌파는 감지된 추세의 변화를 촉발할 수 있습니다.
사용 목적
이 지표는 가격 행동, 지지/저항, 유동성 분석 또는 기타 기술 도구와 함께 시장 구조 레이어로 사용할 수 있습니다. 다양한 시간대에 걸친 스윙 구조를 더 깔끔하게 시각적으로 표현하려는 트레이더에게 적합합니다.
참고: 이 지표는 기술적 분석 도구이며 금융 조언을 제공하거나 거래 결과를 보장하지 않습니다.
요약
AI 요약
FractalMS by SeekXow is a price-action indicator that identifies and visualizes market structure using confirmed fractal pivots. It detects swing highs and lows and classifies them into four pivot types: Higher High (HH), Higher Low (HL), Lower High (LH), and Lower Low (LL). By relying on confirmed fractal pivots, the indicator reduces noise and avoids repainting, compressing consecutive pivots of the same type to retain relevant extremes before evaluating market structure.
Key features include automatic classification of pivot types, bullish and bearish market structure detection, trend-state identification, visual horizontal structure levels, and trend background visualization. The indicator continuously adapts as new confirmed pivots develop.
FractalMS works by detecting confirmed swing highs and lows, processing them into an alternating sequence to determine current market structure and trend. During uptrends, it identifies higher highs and higher lows; during downtrends, it identifies lower highs and lower lows. Breaking structural levels signals potential trend changes.
Designed for discretionary price-action and market-structure analysis, this tool supports traders seeking a clearer visual representation of swing structure across multiple timeframes. It complements other technical tools such as support/resistance and liquidity analysis.
Key features include automatic classification of pivot types, bullish and bearish market structure detection, trend-state identification, visual horizontal structure levels, and trend background visualization. The indicator continuously adapts as new confirmed pivots develop.
FractalMS works by detecting confirmed swing highs and lows, processing them into an alternating sequence to determine current market structure and trend. During uptrends, it identifies higher highs and higher lows; during downtrends, it identifies lower highs and lower lows. Breaking structural levels signals potential trend changes.
Designed for discretionary price-action and market-structure analysis, this tool supports traders seeking a clearer visual representation of swing structure across multiple timeframes. It complements other technical tools such as support/resistance and liquidity analysis.
지표 프로필
지표 카테고리
시장 구조 (SMC)
출력 유형
시각화
데이터 요구 사항
막대만
지원되는 신호
돌파
추세 강도
레벨 돌파
반전
레벨 터치
고객 리뷰
0.0
리뷰: 0
고객 리뷰
이 상품에 대한 리뷰가 아직 없습니다. 이미 사용해 보셨나요? 다른 사람들에게 가장 먼저 소개해 주세요!
상담
자주 묻는 질문(FAQ)
Key Levels
MSS
Market Structure
Support & Resistance
트레이딩 봇, 지표, 플러그인 등 cTrader Store에서 제공되는 상품은 제3자 개발자에 의해 제공되며, 이는 단순히 정보 및 기술적 접근을 목적으로 제공된 것입니다. cTrader Store는 중개인이 아니며, 투자 조언, 개인별 추천 또는 향후 성과에 대한 어떠한 보장도 제공하지 않습니다.
이 작성자의 상품 더 보기



















가격
가입일 09/12/2025
8.14M
거래량
16.34K
핍 수익