present
Kaydolun ve ilk alışverişinizde $50 indirim kazanın
Trading product for Smart Liquidity Matrix Gösterge Premium/Discount  Fair Value Gap, image 1
Smart Liquidity Matrix
Gösterge
Sürüm 1.0, Sep 2026
Windows, Mac
4.2
Değerlendirmeler: 5
Trading product for Smart Liquidity Matrix Gösterge Premium/Discount  Fair Value Gap, image 2
Trading product for Smart Liquidity Matrix Gösterge Premium/Discount  Fair Value Gap, image 3
Trading product for Smart Liquidity Matrix Gösterge Premium/Discount  Fair Value Gap, image 4
Trading product for Smart Liquidity Matrix Gösterge Premium/Discount  Fair Value Gap, image 5
Trading product for Smart Liquidity Matrix Gösterge Premium/Discount  Fair Value Gap, image 6
Trading product for Smart Liquidity Matrix Gösterge Premium/Discount  Fair Value Gap, image 7
Trading product for Smart Liquidity Matrix Gösterge Premium/Discount  Fair Value Gap, image 8
Trading product for Smart Liquidity Matrix Gösterge Premium/Discount  Fair Value Gap, image 9
Trading product for Smart Liquidity Matrix Gösterge Premium/Discount  Fair Value Gap, image 10
Trading product for Smart Liquidity Matrix Gösterge Premium/Discount  Fair Value Gap, image 11
16
Satışlar
333
Ücretsiz yüklemeler

Açıklama

Smart Likidite Matrisi, kurumsal emir akışının geride bıraktığı yapıyı işaretler ve aynı kurulumu yirmi dört zaman diliminde eşzamanlı olarak takip eder.

aynı anda okur.


NE ÇİZER


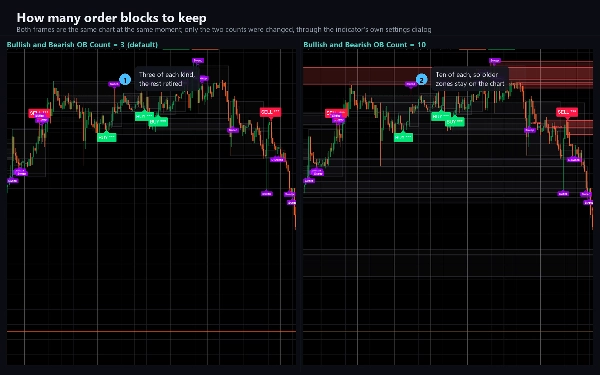
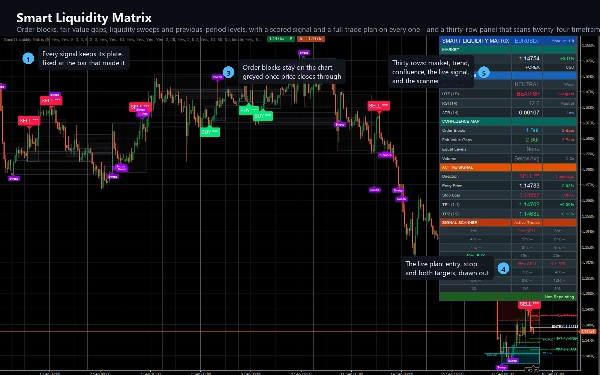
Emir blokları. Her onaylanmış dönüşte, hareketten önceki son zıt mum kutu içine alınır. Bölge

fiyat onun üzerinden kapanana kadar aktif kalır, sonra kaybolmak yerine griye döner, böylece

nerede olduğunu hala görebilirsiniz.


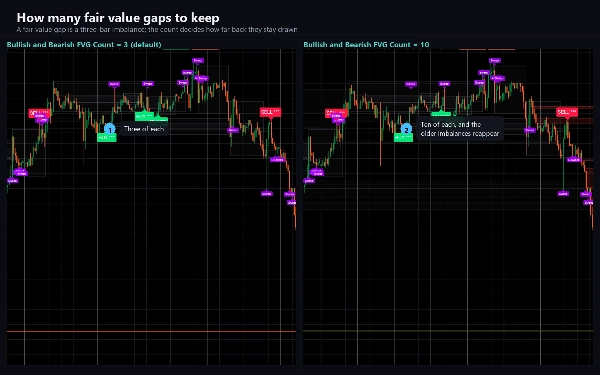
Adil değer boşlukları. Üç mumluk dengesizlikler, oluşur oluşmaz çizilir ve fiyat tekrar üzerinden kapanınca griye döner.

üzerinden kapanınca griye döner.


Eşit yüksekler ve düşükler. Mevcut ATR'nin onda biri içinde eşleşen dönüşler, noktalı bir

seviye ile birleştirilir ve EQH veya EQL olarak etiketlenir. Bunlar likidite süpürmelerinin avlandığı havuzlardır.


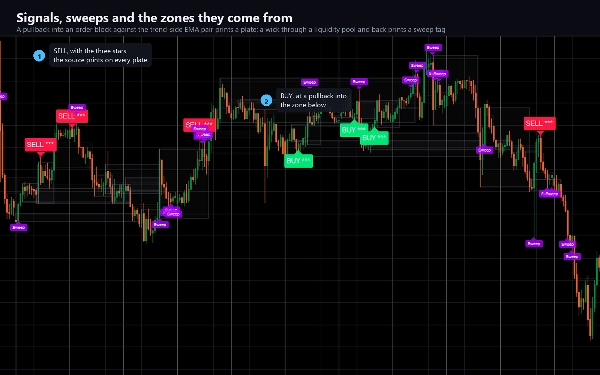
Likidite süpürmeleri. Fiyat eşit bir seviyeyi veya önceki dönem yüksek veya düşüğünü fitillediğinde ve

tekrar içine kapanınca, mum işaretlenir. Her süpürme bir uyarı tetikleyebilir.


Önceki dönem seviyeleri ve denge. Önceki günün yüksek ve düşükleri, kendi parıltılarıyla çizilir,

artı mevcut dönüş yüksek ve düşük arasındaki yüzde elli çizgisi.


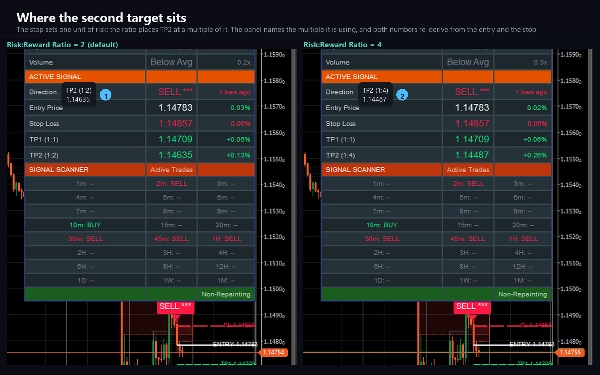
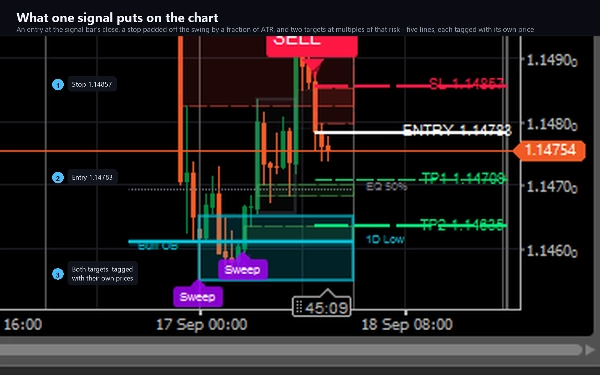
Risk resmiyle alım ve satım sinyalleri. Trend tarafı EMA çiftine karşı bir geri çekilme girişi,

giriş, durdurma ve iki hedef, mumun sağında çizilir ve fiyatlarıyla etiketlenir.


TARAMA ARACI


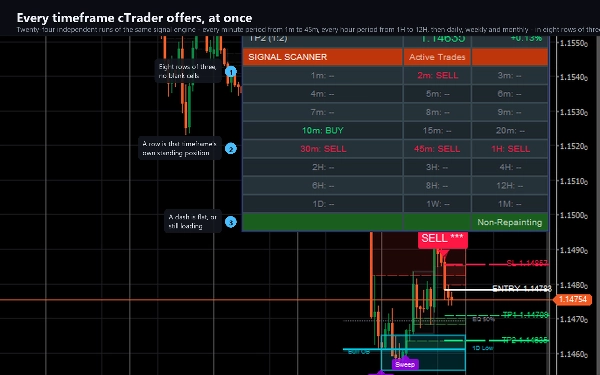
Gösterge panelinin alt üçte biri, aynı sinyal mantığını yirmi dört zaman diliminde

bağımsız olarak, bir dakikadan bir aya kadar çalıştırır ve her birinin şu anda uzun, kısa veya boş

tuttuğunu gösterir. Komşu satırlar arasındaki uyum önemlidir: otuz, kırk beş ve bir saatlik

satış sinyalleri, tek bir satırdaki yalnız bir sinyalden çok farklı okunur.


Bu yirmi dört, cTrader'ın sunduğu tüm standart zaman dilimleridir: bir, iki, üç, dört, beş, altı,

yedi, sekiz, dokuz, on, on beş, yirmi, otuz ve kırk beş dakika, sonra bir, iki, üç, dört,

altı, sekiz ve on iki saat, sonra günlük, haftalık ve aylık. Her biri grafikle aynı mum verisinden okunur,

bu yüzden burada broker mum geçmişinize bağlı hiçbir şey yoktur ve tam olarak üçerli sekiz satırı

doldururlar, boş hücre yoktur.


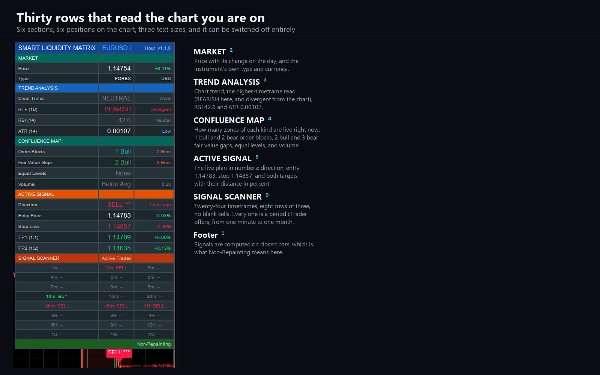
GÖSTERGE PANELİ


Altı bölümde otuz satır: piyasa, trend analizi, örtüşme haritası, aktif sinyal,

tarama aracı ve bir alt bilgi. Altı pozisyon, üç metin boyutu ve tamamen kapatılabilir. Satır

yüksekliği, genellikle tarayıcı grafiğinden daha kısa olan bir cTrader grafik paneli için ayarlanmıştır.


UYARILAR VE OTOMASYON


Sinyaller, yapı olayları ve süpürmeler için günlük, ses ve e-posta uyarıları, tek bir mumun

bir mesaj oluşturması için çoğaltılmadan. Dahili bir webhook, aynı olayları JSON olarak istediğiniz

her adrese cTrader'ın kendi ağ hizmeti üzerinden gönderir, böylece bir bot veya günlük bunlara

tepki verebilir. Adres girene kadar kapalı kalır, gösterge geçmiş yüklerken tetiklenmez, geriye dönük testte tetiklenmez ve

oran sınırlamasına tabidir.


Gösterge herhangi bir yükseltilmiş izin talep etmez. Dosyalarınızı okuyamaz veya bir işlem başlatamaz.


AYARLAR


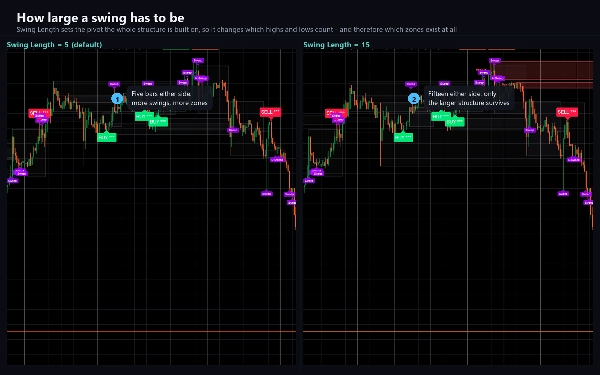
On altı grupta yetmiş parametre. Her bölge sayısı, rengi, zaman dilimi ve etiket pozisyonu

ayarlanabilir ve Lite Modu, daha temiz bir grafik için her satırı inceltir.


UYGUN OLDUĞU ALANLAR


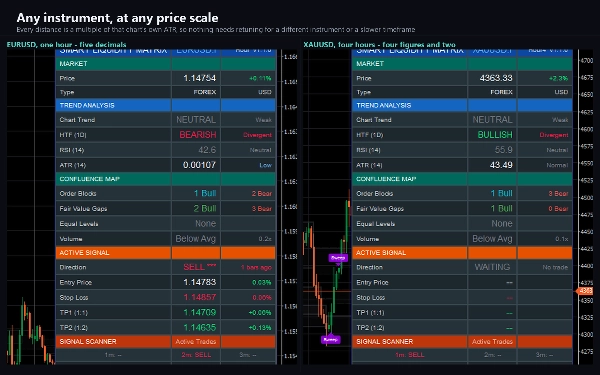
Forex, endeksler, metaller ve kripto CFD'leri. Herhangi bir zaman dilimi; varsayılanlar bir saatlikte ayarlanmıştır. Tarama

bölümü en bilgilendirici olan beş dakika ile dört saat arasındadır.


YAPMADIĞI ŞEYLER


Emir vermez, değiştirmez veya kapatmaz. Bir analiz ve uyarı aracıdır. Sinyaller sadece kapanmış

mumlar üzerinde hesaplanır ve yeniden çizilmez.


Ticaret risk içerir. Geçmiş performans gelecekteki sonuçları garanti etmez.

Özet

YZ özeti
Smart Liquidity Matrix is a market structure indicator designed for use on cTrader charts, supporting Forex, indices, metals, and crypto CFDs across all timeframes. It identifies and visually marks key institutional order flow features such as order blocks, fair value gaps, equal highs and lows, liquidity sweeps, and previous period levels. Order blocks highlight the last opposite candle before confirmed swings, while fair value gaps show three-bar imbalances. Equal highs and lows are connected to indicate liquidity pools targeted by sweeps, which are marked when price wicks beyond these levels but closes back inside. The indicator also displays buy and sell signals with entry, stop, and target levels based on trend-side EMA pullbacks.

A unique feature is its 24-timeframe signal scanner, which independently analyzes from one minute to monthly intervals, showing long, short, or neutral signals to identify multi-timeframe agreement. The dashboard organizes information into six sections including market data, trend analysis, confluence, active signals, and the scanner, optimized for cTrader’s chart pane.

Alerts can be configured for signals, structure events, and sweeps, with options for log, sound, email, and webhook notifications for automation or journaling. The indicator uses closed bars only and does not repaint. It offers extensive customization with seventy adjustable parameters and a Lite Mode for cleaner visuals. It does not execute trades but serves as an analytical and alerting tool.
Gösterge profili
Gösterge kategorisi
Piyasa yapısı (SMC)
Çıktı türü
Sinyaller
Veri gereklilikleri
Yalnızca çubuklar
Desteklenen sinyaller
Kırılma
Yön değiştirme
Seviyeye dokunuş
Seviye kırılması

Tartışma

Müşteri değerlendirmeleri

4.2
Değerlendirmeler: 5
5
20 %
4
80 %
3
0 %
2
0 %
1
0 %
Müşteri değerlendirmeleri
October 23, 2026
the 24 timeframe scan brings entry and structure context into one convenient display. EMA pullbacks generate the arrows while blocks, gaps and sweeps are separate drawings, so a nearby zone does not automatically confirm the entry.
October 11, 2026
twenty four timeframe coverage gives the scanner a broad view beside blocks, FVGs and sweeps. Entries still come from a separate EMA pullback process. The extra context doesn't quietly turn every structural mark into part of the arrow's logic.
October 11, 2026
the arrows and boxes share a screen, but they don't do the same job. EMA pullbacks provide entries while blocks and gaps describe structure across the 24 timeframe view. Keeping that distinction clear makes the combined overlay more useful.
October 6, 2026
A block beside an arrow isn't automatically one setup. The overlay draws structural zones separately from its EMA pullback entries. Seeing both together is handy, as long as proximity isn't mistaken for a rule the tool never specified.
October 4, 2026
Tested on EURUSD H1 and XAUUSD H1/M1. Order Blocks, FVG zones, liquidity sweep markers and BUY/SELL labels rendered correctly. The dashboard provided clear market context, and the 24-timeframe scanner showed consistent states across XAUUSD charts. WAITING displayed correctly without active trade levels. Main UX issues are overlapping Sweep labels and the large dashboard footprint.

SSS

Premium/Discount
Fair Value Gap
Key Levels
Liquidity Sweep
Order Block
Market Structure
Liquidity Grab
cTrader Store üzerinden erişilebilen işlem botları, göstergeler ve eklentiler gibi ürünler, üçüncü taraf sağlayıcılar tarafından sağlanır ve yalnızca bilgilendirme ve teknik erişim amaçlarıyla sunulur. cTrader Store bir broker değildir ve yatırım tavsiyesi, kişisel öneriler vermez veya gelecekteki performansı garanti etmez.

Bu oluşturanın diğer ürünleri

Gösterge
ATR
CCI
+4
A trend line that never steps back, a shaded band to the price, and a pointer at the swing where the trend turns.
"Bullion Horizon" logosu
Canlı istatistikler
5.0
(2)
$97
/
$147
cBot
Balanced
Fixed Lot
+5
Gold grid cBot for XAUUSD H1: four-signal confluence on closed bars, ladders closed at a basket profit, news filter
15.6%
ROI
2.33
Kâr faktörü
Gösterge
ATR
EMA
+3
EMA cross filtered by a trend average and its ATR channel, with long, short and close marks and colored candles.
Gösterge
ATR
RSI
+4
Adaptive Ichimoku with nine-factor confluence scoring, five signal types, smart TP/SL and an MTF panel.
Gösterge
ATR
RSI
+5
Fusion trend line with a layered cloud, BULL and BEAR labels, scored re-entry triangles and exit markers.
Gösterge
ATR
RSI
+4
RSI bands drawn on price, confluence-scored BUY/SELL signals, an ATR stop with three targets
Gösterge
ADX
ATR
+5
EMA-cross signals scored on six confluence layers, with an ATR stop, three targets and a live panel
Gösterge
ATR
EMA
+4
Range-filter BUY/SELL signals scored by four confluence layers, with a stop, five targets and a trend panel
Gösterge
ADX
ATR
+5
SuperTrend signals scored on five confluence factors, with an ATR stop, three targets and a dashboard.
"QuotientDrift" logosu
Canlı istatistikler
5.0
(1)
$97
/
$147
cBot
TP Manager
Break Even
+5
Gold cBot for prop-firm accounts: pick your firm, phase and size; risk is sized from the firm's rules, its limits kept
1.6
Kâr faktörü
Gösterge
ATR
Volume
+3
Fibonacci trend signals on closed bars, with an ATR stop, up to four targets and a break-even ladder.
Gösterge
ATR
EMA
+2
Eight-EMA ribbon with ATR trade zones, a nine-symbol screener and a five-timeframe trend dashboard.

Şunları da beğenebilirsiniz

Gösterge
Prop
Forex
+13
🎯Automatically detects and visualizes classical chart patterns using multi-timeframe swing point analysis.
Gösterge
VWAP
Support & Resistance
Trading.FC$_vwap Algo shows VWAP trends, dynamic support/resistance and deviation bands to spot potential trade entries.
Gösterge
Risk Dashboard
AI-powered daily range forecasts help traders spot volatility opportunities and plan stops and targets.
Gösterge
Indices
Commodities
The Advanced CCI & EMA Indicator combines the CCI with 40 & 80 EMA logic to generate precise arrows signaling direction
Gösterge
Prop
Forex
+5
Tracks NY, London, Tokyo, Sydney sessions with custom visuals, and a real-time expanding range box and breakout High/Low
Gösterge
EMA
AI-assisted
+1
Multi EMA Timeframes lets you stay on your chart and see the exact EMA from any timeframe you choose — up to 5 at once.
Gösterge
SMC
Prop
+17
Unlock the true intent of market participants with the Classic Proportional Cumulative Volume Delta CVD!
Gösterge
RSI
Forex
+6
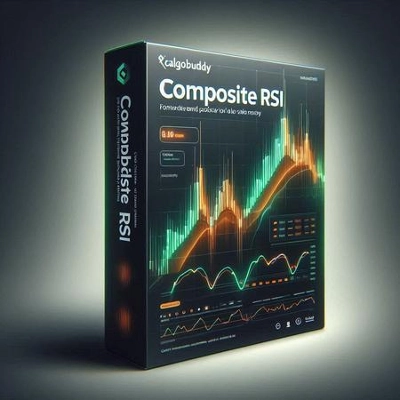
What Constance Brown did with the RSI was to input a momentum calculation within the RSI itself. This the Composite RSI.
"SupertrendChannels" logosu
En yüksek puanlı
4.7
(4)
$19
/
$20
Gösterge
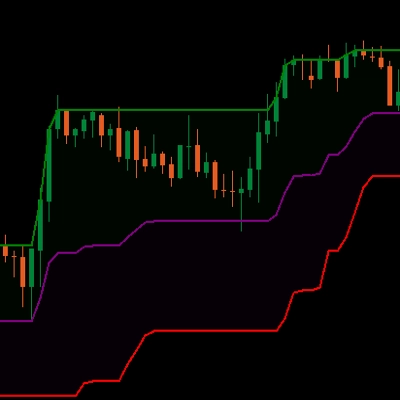
Supertrend-based channel for entries, trailing stops, and dynamic support/resistance zones.
Gösterge
Fair Value Gap
Liquidity Grab
+2
PRO Liquidity Sweep + FVG Combo detector with custom Gold/Blue signals & alerts
Gösterge
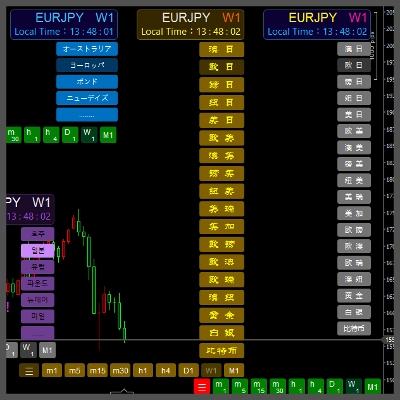
This indicator can be used to: change color, shape size, position, change font, increase or decrease, and other function
"MARainbow" logosu
En yüksek puanlı
4.2
(4)
$19
/
$38
Gösterge
Forex
Crypto
+3
MARainbow gives you the edge with four customizable moving averages—each color-coded for instant recognition.
Gösterge
EMA
RSI
+5
MACD Colour Histogram with 11 Moving Average Types, Multi-timeframe confirmation and Sound Signal Alert.
Gösterge
Forex
Enhance your trading strategy with automated detection and alerts for key chart patterns.
Gösterge
Volume
Key Levels
View tick activity across a selected chart range with Point of Control, Value Area High and Value Area Low.
Gösterge
ATR
Volume
+2
Nine timeframe cards, vivid candles, native BUY/SELL arrows and adjustable ATR-buffer stop-loss reference lines.
Gösterge
AI
ATR
+25
On-chart draggable panel to show/hide Positions & Pending Orders with fixed warning banner and inline alerts per symbol.
Gösterge
Supertrend
Moving Average
Adaptive MA anchored to structural trend changes — no fixed period. Dual Supertrend + swing detection.

Fiyat

16
Satışlar
333
Ücretsiz yüklemeler