
DEnvelopSystem
Indicatore
Versione 1.0, Aug 2025
Windows, Mac
5.0
Recensioni: 1
Descrizione
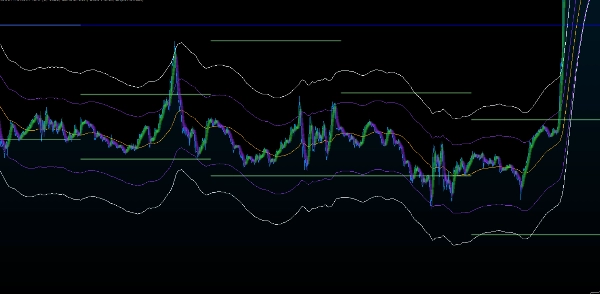
📈 DEnvelopSystem — Precisione dell'Envelope a Doppio Timeframe
DEnvelopSystem è un indicatore di trading ad alte prestazioni progettato per scalper e strateghi intraday che richiedono precisione, adattabilità e congiunzione. Progettato per operare senza soluzione di continuità su timeframe da 1 a 5 minuti, questo strumento combina due envelope di medie mobili provenienti da due timeframe distinti, offrendo un quadro dinamico sia per strategie di seguire il trend che di mean-reversion.
🔧 Caratteristiche principali
- Fusione di Envelope a Doppio Timeframe
Sovrapponi envelope da due timeframe per catturare la volatilità a breve termine all'interno di movimenti strutturali più ampi. Ideale per identificare micro-ritracciamenti nei macro-trend. - Deviazione Percentuale Personalizzata del Prezzo
Regola la sensibilità dell'envelope con soglie percentuali regolabili, permettendo ai trader di definire le proprie bande di volatilità e zone di breakout. - Visualizzazione a Cinque Linee
Mostra un totale di cinque linee: due limiti superiori, due limiti inferiori e una media mobile centrale — creando una mappa visiva chiara del comportamento del prezzo e delle zone di compressione. - Zone di Congiunzione Codificate a Colori
La colorazione personalizzata evidenzia le aree chiave di sovrapposizione e divergenza, rendendo immediatamente riconoscibili le zone di ingresso ad alta probabilità. - Sinergia tra Trend e Reversione
Che tu stia cavalcando il momentum o attenuando gli estremi, DEnvelopSystem si adatta alla tua strategia — offrendo segnali affidabili sia per setup di breakout che di rimbalzo
🎯 Perché i Trader lo Amano
- Strumento Fondamentale di Congiunzione: Agisce come un ancoraggio visivo per setup multi-indicatore, aiutando a confermare gli ingressi con precisione.
- Ottimizzato per lo Scalping: Progettato per ambienti frenetici dove il tempismo e la chiarezza sono tutto.
- Maestria negli Ingressi: Individua le zone in cui il prezzo interagisce con i confini dell'envelope attraverso i timeframe — ideale per ingressi stile cecchino e posizionamenti stretti dello stop.
Riepilogo
Profilo indicatore
Recensioni dei clienti
5.0
Recensioni: 1
5 | 100 % | |
4 | 0 % | |
3 | 0 % | |
2 | 0 % | |
1 | 0 % |
Discussioni
Domande frequenti
I prodotti disponibili tramite cTrader Store, inclusi bot di trading, indicatori e plugin, sono forniti da sviluppatori terzi e resi disponibili esclusivamente a scopo informativo e di accesso tecnico. cTrader Store non è un broker e non fornisce consulenze in materia di investimento, raccomandazioni individualizzate o garanzie di risultati futuri.


Prezzo
25
Vendite
2.1K
Installazioni gratuite