
Descripción
Trend Scope Pro es un indicador técnico de nivel profesional diseñado para brindar a los traders una comprensión más profunda de la estructura del mercado y la dirección del precio. Basado en avanzados algoritmos de regresión lineal, esta herramienta calcula una línea de regresión dinámica junto con tres niveles de canales de desviación estándar. Al combinar precisión estadística con claridad visual, te ayuda a identificar fácilmente las tendencias actuales del mercado, zonas potenciales de reversión y rangos de volatilidad, convirtiéndolo en una adición accesible pero poderosa para cualquier conjunto de herramientas de trading.
Cómo leer Trend Scope Pro
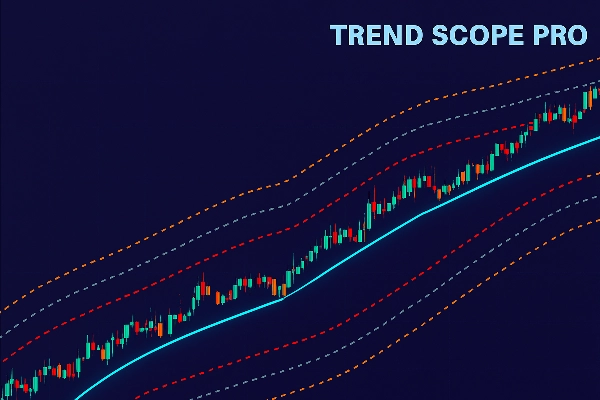
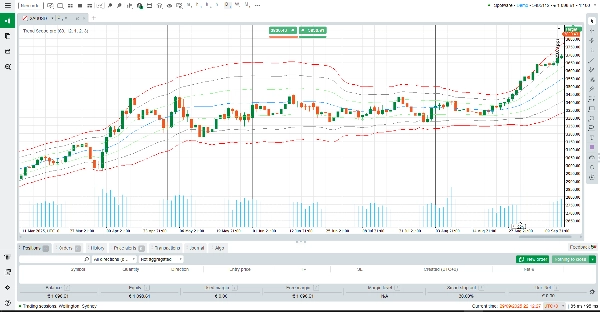
Cuando se aplica a tu gráfico, Trend Scope Pro dibuja una línea de regresión central (azul), que representa el “valor justo” o la dirección promedio de la tendencia durante un período definido. Alrededor de esta línea, se trazan tres conjuntos de canales superiores e inferiores (naranja, gris y rojo). Cada canal se calcula usando un multiplicador diferente de desviación estándar:
Superior/Inferior 1 (Naranja): Representa la primera desviación estándar. Los movimientos de precio dentro de esta zona suelen reflejar la volatilidad normal a corto plazo.
Superior/Inferior 2 (Gris): Marca desviaciones más fuertes. Alcanzar esta zona suele señalar un movimiento extendido o un impulso en desarrollo.
Superior/Inferior 3 (Rojo): Zonas extremas donde el mercado puede estar sobrecomprado o sobrevendido, creando oportunidades potenciales de reversión.
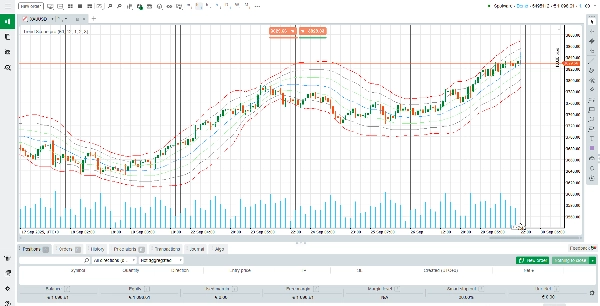
En la práctica, los traders pueden usar la línea de regresión para confirmar la dirección de la tendencia, mientras que los canales actúan como niveles dinámicos de soporte y resistencia. Por ejemplo:
Si el precio se mantiene consistentemente por encima de la línea de regresión, la tendencia es alcista.
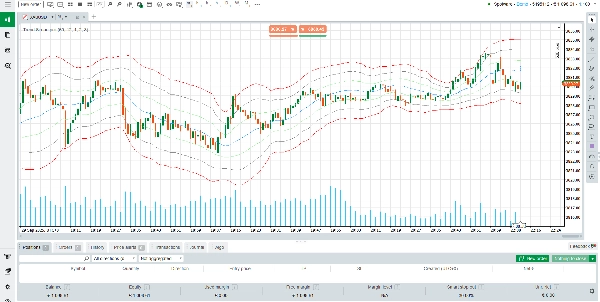
Si el precio prueba repetidamente o rompe por debajo de la línea de regresión, la tendencia se está debilitando.
Los toques extremos en los canales rojos pueden destacar puntos de agotamiento, donde es más probable que ocurran reversiones o retrocesos.
Cómo funciona el indicador
Trend Scope Pro calcula una línea de regresión analizando los precios de cierre durante un período de retroceso elegido. Luego mide la desviación estándar del precio respecto a esta línea, lo que determina el ancho de cada canal. Este enfoque estadístico asegura que el indicador se adapte a la volatilidad en tiempo real, proporcionando un equilibrio entre señales de seguimiento de tendencia y perspectivas de reversión a la media.
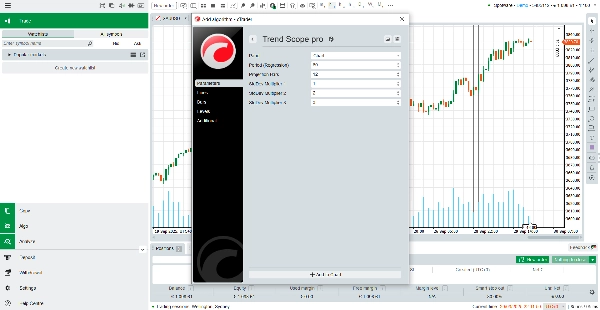
Los ajustes predeterminados (60 barras de retroceso, multiplicadores 1.0, 2.0, 3.0) están optimizados para la mayoría de los instrumentos, pero puedes ajustarlos fácilmente para adaptarlos a tu estrategia o marco temporal. Ya seas un trader diario buscando entradas intradía, o un trader de swing analizando ciclos de mercado más amplios, Trend Scope Pro ofrece un contexto confiable para la toma de decisiones.
Características clave de Trend Scope Pro
Regresión Lineal Adaptativa – Calcula dinámicamente la tendencia central del mercado para una precisión en el sesgo direccional.
Canales de Múltiples Niveles – Tres conjuntos de bandas de desviación ayudan a identificar movimientos normales, tendencias fuertes y condiciones extremas.
Claridad Visual – Líneas limpias y codificadas por colores que facilitan la interpretación de la acción del precio de un vistazo.
Configuraciones Personalizables – Períodos de retroceso y multiplicadores de desviación flexibles para adaptarse a cualquier estilo de trading.
En resumen, Trend Scope Pro combina fiabilidad estadística con usabilidad práctica. Es más que una simple línea de tendencia: es un marco completo para analizar el comportamiento del precio, identificar zonas de alta probabilidad y mejorar el momento de las operaciones. Ya sea que busques confirmación de la tendencia, anticipar reversiones o simplemente añadir estructura a tus gráficos, Trend Scope Pro ofrece la claridad y confianza que necesitas.
Resumen
Valoraciones de clientes
5 | 50 % | |
4 | 50 % | |
3 | 0 % | |
2 | 0 % | |
1 | 0 % |


![Logotipo de "[Hamster-Coder] Pivot Points MTF"](https://cdn.ctrader.com/image/webp/4c143e5a-309c-40e3-a578-f04d1e133ffa_31159)


