
Regression Channel
อินดิเคเตอร์
เวอร์ชัน 1.0, Nov 2025
Windows, Mac
คำอธิบาย
เปลี่ยนความสับสนของราคาให้กลายเป็นช่องแนวโน้มที่ชัดเจนด้วยคณิตศาสตร์การถดถอยอย่างแม่นยำ
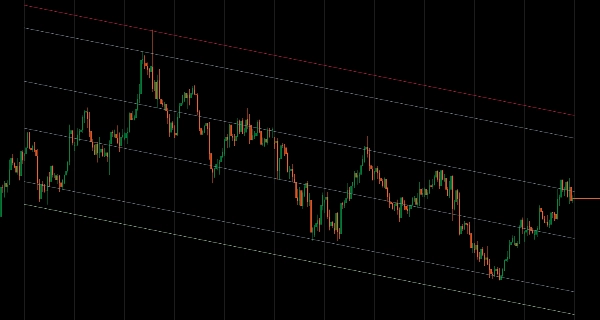
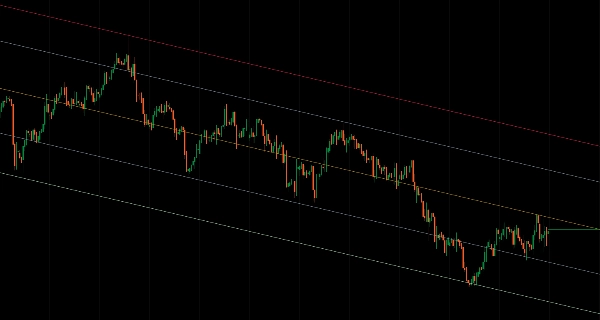
Regression Channel คำนวณเส้นถดถอยเชิงเส้นผ่านข้อมูลราคาที่คุณเลือกและวาดขอบเขตบน/ล่างตามการเบี่ยงเบนของราคา - มอบมุมมองที่มีพื้นฐานทางสถิติของทิศทางแนวโน้มและโซนที่อาจเกิดการกลับตัว
เหมาะสำหรับ
- ผู้เทรดโครงสร้างที่ต้องการการกำหนดแนวโน้มอย่างเป็นวัตถุประสงค์
- ผู้เทรดแบบกลับสู่ค่าเฉลี่ยที่ระบุระดับซื้อมาก/ขายมากเกินไป
- ผู้เทรดเบรกเอาต์ที่สังเกตการละเมิดช่องและการเปลี่ยนแปลงโมเมนตัม
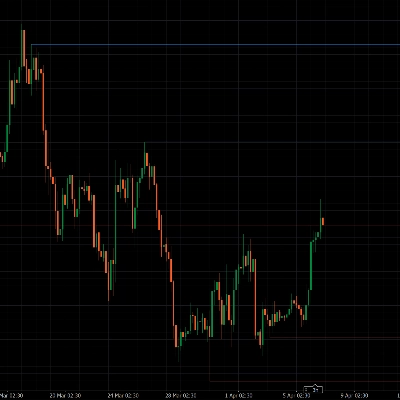
- การวิเคราะห์หลายกรอบเวลา - วาดเส้นถดถอยรายเดือนบนชาร์ตรายวันเพื่อบริบท
คุณสมบัติหลัก
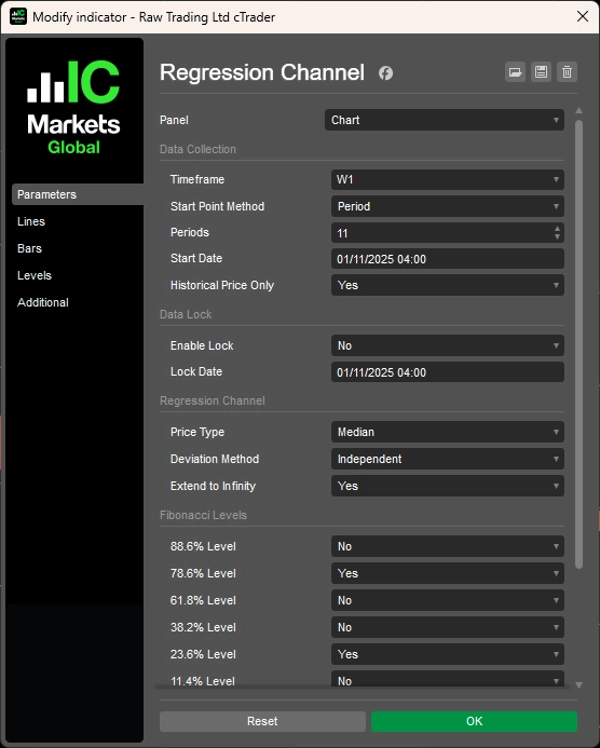
- การเลือกข้อมูลที่ยืดหยุ่น
-
- โหมดช่วงเวลา: วิเคราะห์แท่งเทียน N แท่งล่าสุด (เช่น แท่งเทียนรายเดือน 12 แท่งล่าสุด)
- โหมดวันที่และเวลา: เริ่มจากเหตุการณ์ตลาดหรือวันที่เฉพาะเจาะจง
- กลไกล็อก: แช่แข็งการวิเคราะห์ที่จุดประวัติศาสตร์ในขณะที่ราคายังคงเคลื่อนไหว
- หลายกรอบเวลา: วาดเส้นถดถอยจากกรอบเวลาใดก็ได้บนชาร์ตปัจจุบันของคุณ
- วิธีการเบี่ยงเบนอัจฉริยะ
-
- ค่าเฉลี่ย: ระดับสมดุลโดยใช้การเบี่ยงเบนเฉลี่ย (เหมาะสำหรับโซนการเทรด)
- อิสระ: ช่องที่ไม่สมมาตรซึ่งปรับตัวตามความผันผวนในทิศทาง
- สูงสุด: แสดงขอบเขตราคาสูงสุดสำหรับการวิเคราะห์ช่วงเต็ม
- เครื่องมือมืออาชีพ
-
- ระดับ Fibonacci retracement 6 ระดับ (11.4%, 23.6%, 38.2%, 61.8%, 78.6%, 88.6%)
- ประเภทราคา 6 แบบ: เปิด, สูง, ต่ำ, ปิด, มัธยฐาน, แบบทั่วไป
- โหมดเฉพาะประวัติศาสตร์: ยกเว้นแท่งที่กำลังสร้างเพื่อการทดสอบย้อนหลังที่เสถียร
- ตัวเลือกขยายไปยังอนันต์สำหรับการคาดการณ์ระยะยาว
- ปรับแต่งสีได้เต็มที่
ทำไมถึงโดดเด่น
แตกต่างจากเครื่องมือถดถอยพื้นฐาน ตัวบ่งชี้นี้ให้คุณควบคุมได้ ล็อกการวิเคราะห์ของคุณเพื่อศึกษาว่าราคาปฏิบัติอย่างไรหลังจากเหตุการณ์เฉพาะ สลับระหว่างช่องสมมาตรและไม่สมมาตร รวมโครงสร้างกรอบเวลาที่สูงกว่ากับการดำเนินการในกรอบเวลาที่ต่ำกว่า — ทั้งหมดนี้ด้วยโค้ดที่สะอาดและมีประสิทธิภาพที่สร้างขึ้นเพื่อความน่าเชื่อถือ
ชาร์ตที่สะอาด โครงสร้างที่ชัดเจน การตัดสินใจที่มั่นใจ
สรุป
โปรไฟล์อินดิเคเตอร์
รีวิวจากลูกค้า
0.0
รีวิว: 0
รีวิวจากลูกค้า
ยังไม่มีรีวิวสำหรับผลิตภัณฑ์นี้ หากเคยลองแล้ว ขอเชิญมาเป็นคนแรกที่บอกคนอื่น!
การสนทนา
คำถามที่พบบ่อย
Fibonacci
ผลิตภัณฑ์ที่มีให้บริการผ่าน cTrader Store รวมถึงบอทการเทรด อินดิเคเตอร์ และปลั๊กอิน มีให้บริการโดยนักพัฒนาบุคคลที่สามและมีไว้เพื่อวัตถุประสงค์ในการเข้าถึงข้อมูลและทางเทคนิคเท่านั้น cTrader Store ไม่ใช่โบรกเกอร์และไม่ได้ให้คำแนะนำการลงทุน คำแนะนำส่วนบุคคล หรือการรับประกันผลการดำเนินงานในอนาคต


ราคา
ตั้งแต่ 20/12/2024
8.27K
ติดตั้งฟรี