Descrizione
Trading in tempo reale con 'HAI Quantum The Game V2'
Panoramica generale
Questo gioco di trading ti permette di esplorare e praticare strategie di investimento in un ambiente con dati di mercato in tempo reale. A differenza dei simulatori che utilizzano dati fittizi, 'HAI Quantum The Game' opera sui movimenti reali del mercato, rendendolo uno strumento di apprendimento eccezionalmente accurato. I giocatori possono fare trading con tanti strumenti finanziari quanti ne consente il loro spazio di lavoro, sia su uno che su più monitor, offrendo un'esperienza completamente adattabile.
Aggiunge automaticamente rischio-rendimento.
Componenti di analisi tecnica
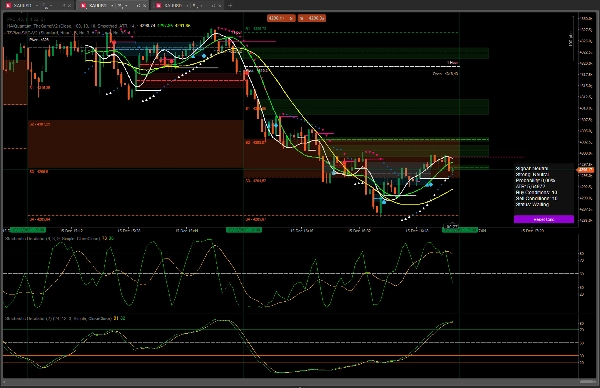
Il gioco integra una serie di strumenti di analisi per migliorare la precisione dei segnali. Questi includono:
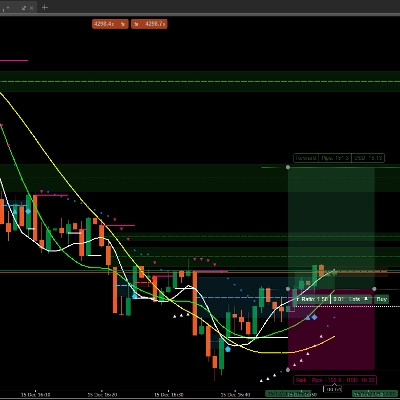
- Medie mobili configurabili: Tre medie mobili che l'utente può regolare per identificare la direzione del trend e potenziali livelli dinamici di supporto o resistenza.
- Parabolic SAR (Stop and Reverse): Un indicatore trend-following che aiuta a determinare la direzione del prezzo e potenziali punti di inversione.
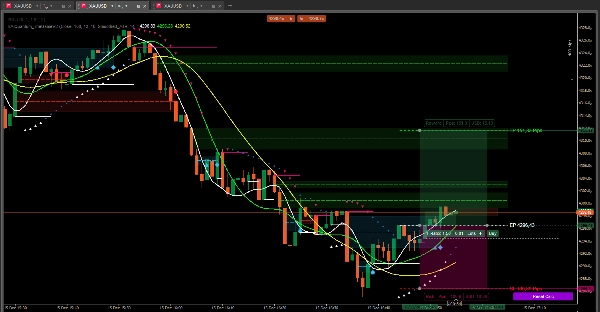
- Pivot Points e Fibonacci Range Box: Questi indicatori sono aggiunti per migliorare l'affidabilità del segnale. TSPivotSMC identificano livelli chiave di supporto e resistenza, mentre Range Box Fibonacci aiutano a definire potenziali zone di inversione e continuazione del trend.
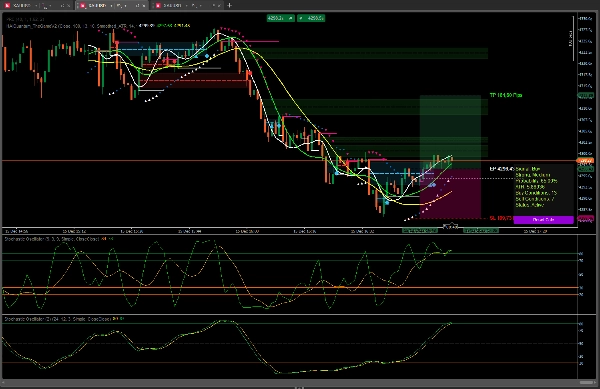
- Oscillatori: Il gioco permette l'aggiunta di indicatori come RSI (Relative Strength Index) o Stocastico, che misurano il momentum del prezzo e aiutano a identificare condizioni di ipercomprato o ipervenduto.
Come giocare
- Selezione dello strumento: Scegli e fai trading sugli asset (coppie di valute, indici, materie prime, ecc.) che desideri analizzare.
- Configurazione del timeframe: Regola il timeframe per ogni strumento singolarmente o applicalo a tutti per un'esperienza unificata.
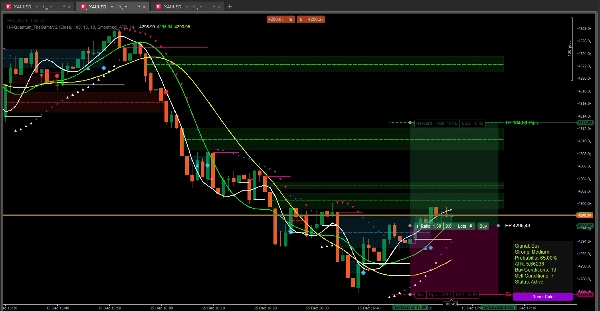
- Analisi e segnali: L'indicatore 'HAI Quantum The Game' genera segnali di acquisto o vendita basati sull'analisi tecnica reale del mercato e sulla conferma degli indicatori incorporati.
- Decisione e gestione del rischio: Una volta che appare un segnale, i giocatori devono prendere una decisione informata. Il sistema offre livelli suggeriti di Stop Loss (SL) e Take Profit (TP), ma puoi impostare i tuoi parametri.
- Monitoraggio e risultati: Dopo aver aperto una posizione, monitora il movimento reale del prezzo fino a quando non viene raggiunto lo Stop Loss o il Take Profit. Al completamento, profitti o perdite vengono calcolati automaticamente.
Vantaggi del gioco
- Alternativa ai corsi costosi: Questo gioco offre un'opportunità unica per imparare a generare reddito reale tramite il trading senza dover spendere una fortuna in corsi teorici.
- Realismo eccezionale: Operando con dati di mercato in tempo reale, affronti le stesse condizioni, volatilità e pattern che incontreresti nel trading reale.
- Analisi multidimensionale: La combinazione di indicatori di trend (medie mobili, Parabolic SAR), livelli chiave (Pivot Points, Fibonacci) e oscillatori (RSI, Stocastico) fornisce una visione completa del mercato.
- Flessibilità operativa: Gioca con tanti strumenti quanti ne consente la configurazione dei tuoi monitor.
- Ambiente senza rischi: Impara sul mercato senza rischiare capitale reale utilizzando un conto demo.
- Vera emozione: Per una sfida maggiore, il gioco può collegarsi a un conto reale, aggiungendo il fattore emozione e rischio finanziario genuino.
https://ctrader.com/products/544?u=Thomas-Sparrow
https://ctrader.com/products/526?u=Thomas-Sparrow


