
Descrizione
Indicatore del Profilo della Tendenza di Deviazione
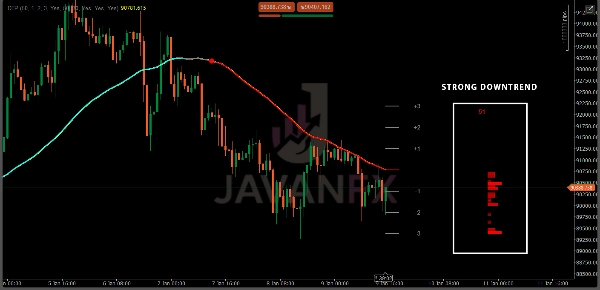
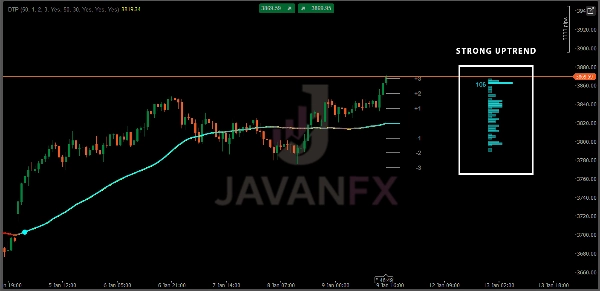
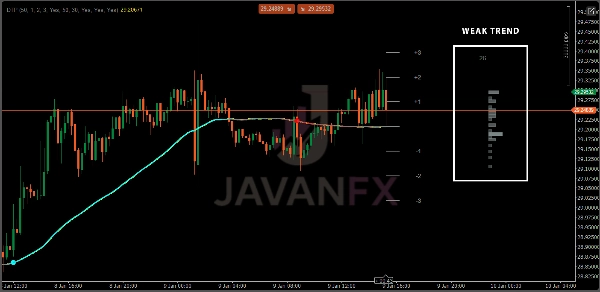
Uno strumento di monitoraggio della tendenza che mostra le aree di movimento dei prezzi e dove i prezzi trascorrono la maggior parte del loro tempo, con segnali che cambiano colore e avvisi sonori quando le tendenze cambiano direzione.
🎯 COME FUNZIONA
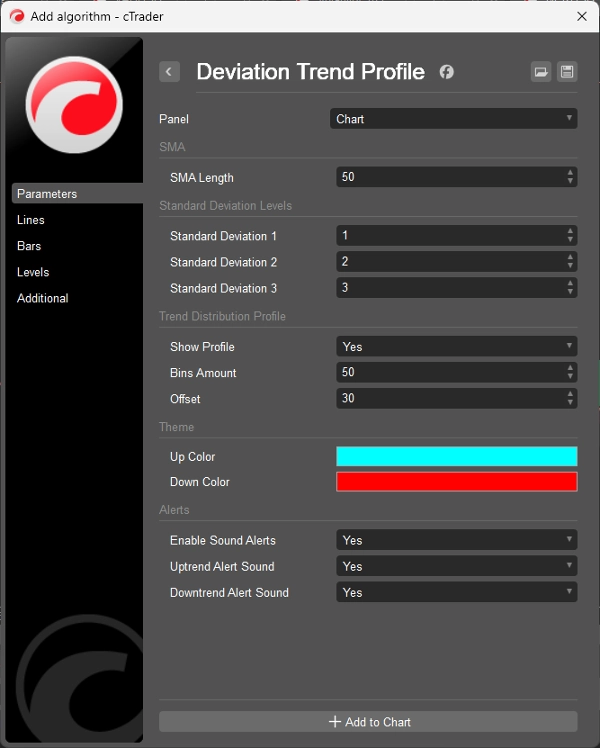
Rilevamento della Tendenza tramite Pendenza SMA: Individua i cambiamenti di tendenza quando la linea del prezzo medio si muove verso l'alto o verso il basso oltre un limite di 0,1, catturando i cambiamenti di momentum mentre accadono.
Zone di Deviazione Standard: Crea bande di prezzo ±1, ±2 e ±3 attorno alla media usando l'ATR, costruendo zone flessibili che si adattano a quanto il mercato è volatile o calmo.
Profilo di Distribuzione della Tendenza: Costruisce un grafico a barre laterale che mostra quanto spesso il prezzo ha chiuso in ogni zona durante la tendenza corrente, rivelando dove il prezzo tende a stabilirsi.
🔵 CARATTERISTICHE
Segnali di Tendenza: Indicatori di cambiamento rapido usando cerchi colorati quando le tendenze si invertono, rendendo facile vedere quando il momentum cambia.
Colorazione del Gradiente SMA: La linea media cambia colore in base alla direzione del movimento—dal rosso (in calo) al ciano (in aumento) per un feedback visivo immediato.
Avvisi Audio: Notifiche sonore opzionali quando iniziano nuove tendenze al rialzo o al ribasso, così non perdi mai cambiamenti importanti del mercato.
Facile da Regolare: Modifica la lunghezza media, le dimensioni delle zone, le barre del grafico e i colori per adattarli al tuo stile di trading.
⚠️ AVVISO DI RESPONSABILITÀ
Questo indicatore è solo a scopo educativo e informativo. Non garantisce profitti né prevede movimenti futuri dei prezzi. Il trading comporta un rischio significativo di perdita e le prestazioni passate non indicano risultati futuri. Usa sempre una corretta gestione del rischio, conduci la tua analisi e non fare mai trading con soldi che non puoi permetterti di perdere. Il creatore non è responsabile per eventuali perdite di trading derivanti dall'uso di questo strumento.
Riepilogo
Recensioni dei clienti
5 | 67 % | |
4 | 33 % | |
3 | 0 % | |
2 | 0 % | |
1 | 0 % |


