Descrizione
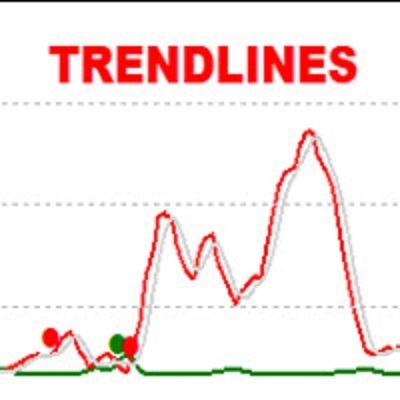
L'Oscillatore Trendlines aiuta i trader a identificare tendenze e momentum basati sulle distanze normalizzate tra il prezzo attuale e le linee di tendenza rialziste e ribassiste rilevate più di recente.
L'indicatore presenta momentum rialzista e ribassista, una linea di segnale con incroci e diverse opzioni di smoothing.
UTILIZZO
L'Oscillatore Trendlines funziona sistematicamente:
- Identificando massimi e minimi pivot.
- Collegando i pivot per formare linee di tendenza rialziste (supporto) e ribassiste (resistenza).
- Misurando la distanza (delta) tra il prezzo attuale e quelle linee di tendenza.
- Normalizzando queste distanze tra 0 e 100 per creare valori di momentum.
- Smussando i valori per segnali più puliti.
- Generando segnali rialzisti e ribassisti quando il momentum incrocia la linea di segnale.
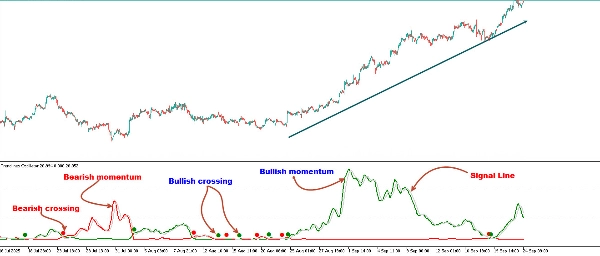
L'oscillatore mostra tre linee chiave:
Linea di Momentum Rialzista (Verde): misura la forza degli acquirenti calcolando quanto il prezzo è distante dalle recenti linee di supporto rialziste.
Linea di Momentum Ribassista (Rossa): misura la forza dei venditori calcolando quanto il prezzo è distante dalle recenti linee di resistenza ribassiste.
Linea di Segnale (Grigia): fornisce incroci con le linee di momentum per evidenziare potenziali opportunità di trading.
Come regola generale, quando la linea di momentum rialzista è sopra quella ribassista, indica forza degli acquirenti. Ciò significa che i prezzi attuali sono più lontani dalle linee di supporto rispetto alle linee di resistenza. Il contrario vale per la forza dei venditori.
Per calcolare il momentum rialzista, lo strumento identifica prima le linee di tendenza rialziste che agiscono come supporto sotto il prezzo. Poi misura il delta tra il prezzo e quelle linee di tendenza e normalizza la lettura nei valori di momentum mostrati.
Lo stesso processo viene utilizzato per il momentum ribassista, ma con linee di tendenza ribassiste che agiscono come resistenza sopra il prezzo.
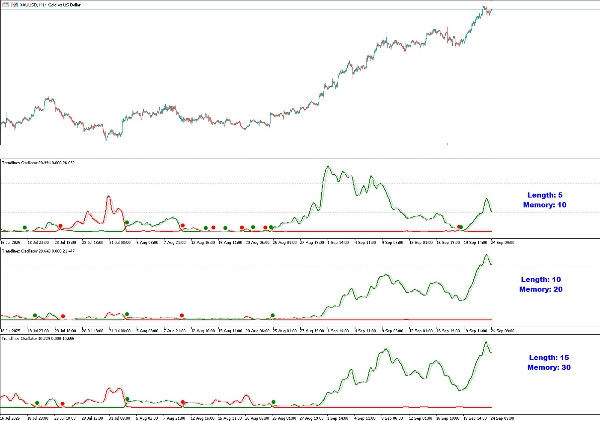
Lunghezza e Memoria
- Lunghezza: determina la dimensione della struttura di mercato utilizzata per rilevare le linee di tendenza. Valori più grandi catturano tendenze più ampie, mentre valori più piccoli rendono lo strumento più sensibile ai movimenti a breve termine.
- Memoria: controlla quante linee di tendenza sono considerate nei calcoli. Valori di memoria più alti smussano i segnali per un'analisi a lungo termine, mentre valori più bassi offrono reazioni più rapide.
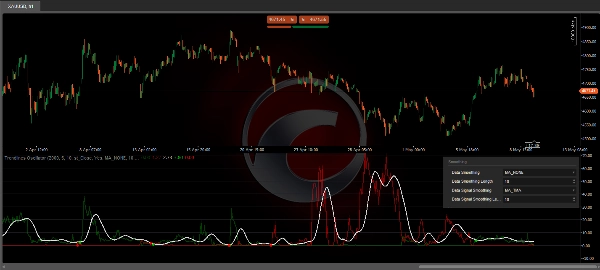
Modificare i valori di Lunghezza e Memoria farà sì che lo strumento mostri valori di momentum diversi.
I trader possono regolare la lunghezza per rilevare linee di tendenza più grandi e regolare la memoria per indicare quante linee di tendenza lo strumento dovrebbe considerare.
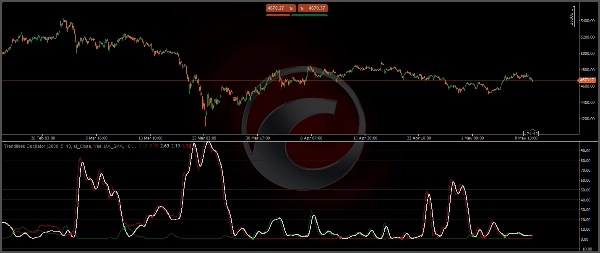
Come mostra il grafico sopra, valori più piccoli rendono lo strumento più reattivo, mentre valori più grandi sono utili per rilevare tendenze più ampie.
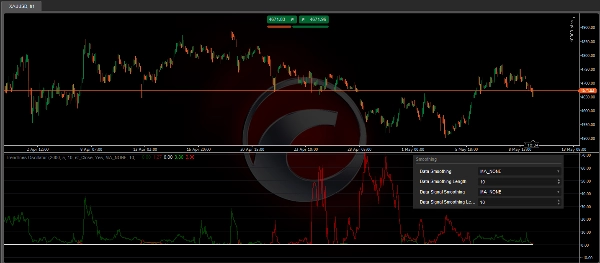
Smoothing
- Smoothing dei dati: applica smoothing ai valori grezzi di momentum.
- Smoothing del segnale: smussa la linea di segnale stessa per punti di incrocio più chiari.
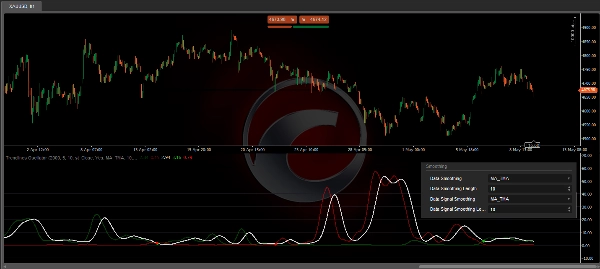
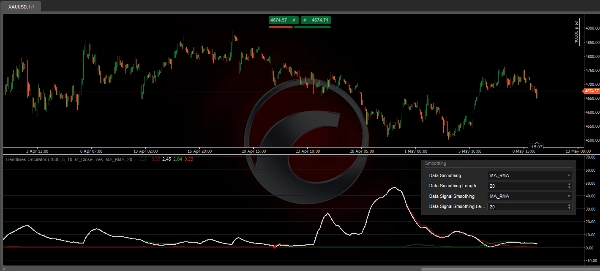
Per impostazione predefinita, i dati sono smussati tramite SMA, e il segnale utilizza una media mobile triangolare con una lunghezza di 10. I trader possono smussare sia i dati che la linea di segnale.
I trader possono scegliere metodi diversi, o nessuno. Alcuni esempi sono mostrati nelle immagini allegate.
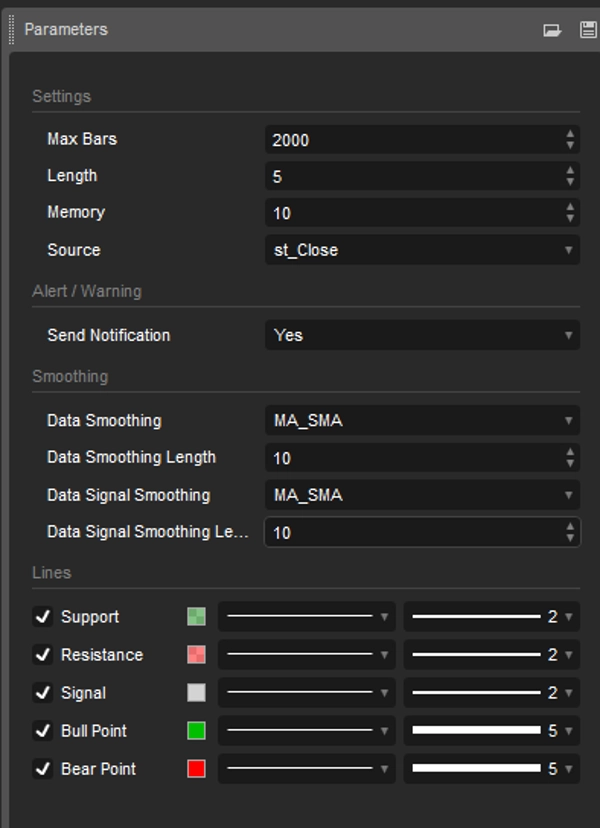
IMPOSTAZIONI
- Lunghezza: la dimensione della struttura di mercato utilizzata per il rilevamento delle linee di tendenza.
- Memoria: il numero di linee di tendenza utilizzate nei calcoli.
- Fonte: la fonte per i calcoli è di default il prezzo di chiusura.
- Smoothing dei dati: scegli il metodo e la lunghezza dello smoothing
- Smoothing del segnale: scegli il metodo e la lunghezza dello smoothing
- Avviso: avviso/notifica in caso di incrocio rialzista/ribassista
- Stili: regola colore, stile, larghezza delle linee di Supporto/Resistenza/Segnale
L'indicatore di trading Oscillatore Trendlines è ideale per i trader che desiderano:
- Una visione del momentum basata sulle linee di tendenza piuttosto che affidarsi esclusivamente a medie mobili o RSI.
- Incroci visivi chiari per segnalare potenziali entrate e uscite.
- Smoothing personalizzabile per adattarsi a diversi stili di trading.
- Uno strumento che evidenzia in tempo reale il dominio tra acquirenti e venditori.
- Combinando l'analisi strutturale del mercato con i calcoli di momentum, questo strumento offre un vantaggio unico nell'individuare sia la continuazione che le opportunità di inversione di tendenza.
Riepilogo
Users can customize the indicator’s sensitivity and responsiveness by adjusting the Length (market structure size for trendline detection) and Memory (number of trendlines considered). The tool also offers data and signal smoothing options using various methods, including SMA and triangular moving averages, to provide clearer signals. The Trendlines Oscillator supports alerts for bullish and bearish crossovers and allows customization of line styles and colors. It provides a structural market analysis combined with momentum calculations to help traders assess buyer versus seller dominance and identify trend continuation or reversal opportunities.


