present
Daftar dan dapatkan potongan bernilai $50 untuk pembelian pertama anda
Trading product for RegimeVisualizer Indikator Flag Volume, image 1
RegimeVisualizer
Indikator
Versi 1.0, Jul 2026
Windows, Mac
Trading product for RegimeVisualizer Indikator Flag Volume, image 2
Trading product for RegimeVisualizer Indikator Flag Volume, image 3
Trading product for RegimeVisualizer Indikator Flag Volume, image 4
Trading product for RegimeVisualizer Indikator Flag Volume, image 5
Sejak 11/01/2025
14.87M
Volum yang didagangkan
1.06M
Pip dimenangi

Penerangan

The problem with regime indicators: they change their minds.

Most regime indicators "learn" from the data while they run. You know the result: the history looks beautiful, because the labels of past bars were silently rewritten after the future arrived. This has a name β€” repainting β€” and it is the cardinal sin of any analysis tool: it looks reliable precisely because it erases its own mistakes.

Regime Visualizer makes a single promise: it never repaints.

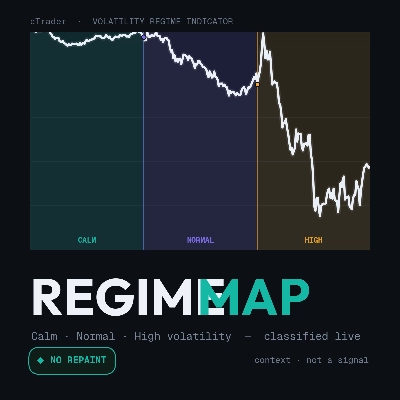
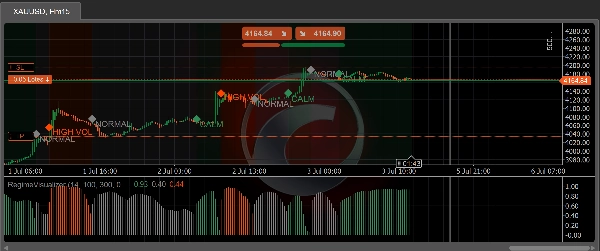
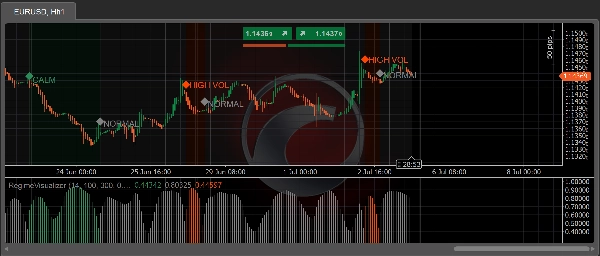
Every bar is classified into one of three volatility regimes β€” Calm, Normal or High β€” at the moment it closes. That label is final. It is never recalculated, smoothed or retroactively corrected. The screenshot you take today shows the same thing that was on the screen live, bar by bar. Deterministic: same data, same picture, on every run.

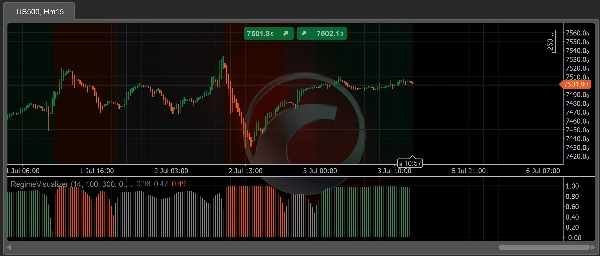
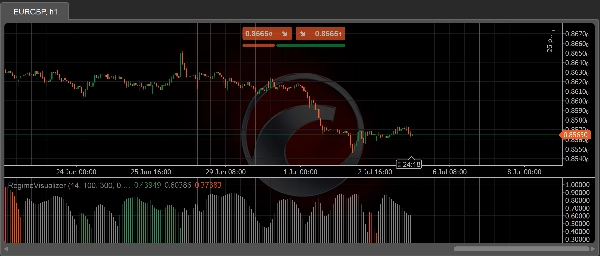
What you see on the chart:

  • 🎨 Colored background per regime segment, right on the price chart
  • πŸ“Š Confidence histogram (0–1) in a separate panel β€” the filtered probability of the active regime, in the regime's color
  • πŸ”· Transition marker β€” icon + label on the bar where the regime changes
  • Each layer toggles on/off independently, with configurable colors

What it is NOT (read before installing):

  • ❌ Not a trading signal. It never tells you to buy or sell.
  • ❌ No performance promise. Volatility regime does not predict profit β€” this indicator makes context readable, nothing more. What you do with it is your responsibility.
  • ❌ Not adaptive. There is no online learning β€” on purpose: "learning while running" is exactly what makes regime indicators repaint.

How it works (for those who want to know):

A 3-state hidden Markov model (HMM) with fixed parameters runs on normalized ATR (ATR(14) / 100-bar ATR average β€” dimensionless, so it works on any instrument and timeframe). Inference is forward filtering only β€” it uses nothing but data up to the close of the current bar, with no Viterbi and no backward smoothing (the classic sources of repainting). A hysteresis layer with thresholds and a minimum dwell time turns the flickering argmax into a stable read.

Honest about its limits:

  • The first 300 bars (warmup) stay unlabeled β€” the indicator does not pretend to know what it does not know yet.
  • The forming bar gets no label β€” it is classified when it closes. That is the price of never repainting, and we pay it in front of you.

For cBot developers:

The indicator exposes the public RegimeCode series (0 = Calm, 1 = Normal, 2 = High, βˆ’1 = warmup) for consumption via Indicators.GetIndicator<RegimeVisualizer>(). Non-repainting volatility context, ready to plug into your logic.

Validation (tested, not claimed):

The non-repaint property was verified by a harness that reprocessed 100,000 real bars across 201 incremental windows β€” 10.1 million label comparisons, zero divergence β€” plus bit-identical determinism across runs.

Free. Context β€” not a signal.

Ringkasan

Profil indikator
Kategori indikator
Volum
Jenis output
Visualisasi
Keperluan data
Bar sahaja
Isyarat yang disokong
Kemeruapan

Perbincangan

Ulasan pelanggan

0.0
Ulasan: 0
Ulasan pelanggan
Belum ada ulasan untuk produk ini. Anda sudah mencuba produk tersebut? Jadilah yang pertama untuk berkongsi pendapat anda!

Soalan Lazim

Flag
Volume
Market Structure
Supply & Demand
Risk Dashboard
ATR
Liquidity Grab
Produk yang tersedia melalui cTrader Store, termasuk bot dagangan, indikator dan plugin, disediakan oleh pembangun pihak ketiga dan diberikan akses untuk tujuan maklumat dan teknikal sahaja. cTrader Store bukan broker dan tidak memberikan nasihat pelaburan, syor peribadi atau sebarang jaminan prestasi masa hadapan.

Anda juga mungkin suka

Indikator
ATR
RSI
+14
A metric that can set 1 to 3 groups of Bollinger Bands
Indikator
Prop
Forex
+4
Ultimate Market Footprint: Price Action Zones (Gaps + Order Blocks + Signals)
Indikator
Crypto
Signal
+3
Candlestick Signal Finder: cTrader indicator that automatically detects and color-codes key Japanese candlestick pattern
Indikator
Risk Dashboard
AI-powered daily range forecasts help traders spot volatility opportunities and plan stops and targets.
Indikator
CandleColourFlow MultiFx - optimized to work on Fx Majors, Fx MInors, Fx Crosses
Indikator
ATR
Key Levels
+2
Detects real-time support and resistance levels with breakout signals, zones, and quality scoring for precise entries.
Indikator
RSI
BTCUSD
+5
Traders Dynamic Index (TDI) β€” Divergence Edition
Indikator
Forex
BTCUSD
+10
Professional position management! Calculate real-time pivots, monitor P&L & costs, and strengthen your strategy.
Indikator
Volume
Support & Resistance
Compare up to 27 symbols across eight timeframes with seven analysis engines and an interactive cTrader dashboard.
Indikator
VWAP
Volume
+5
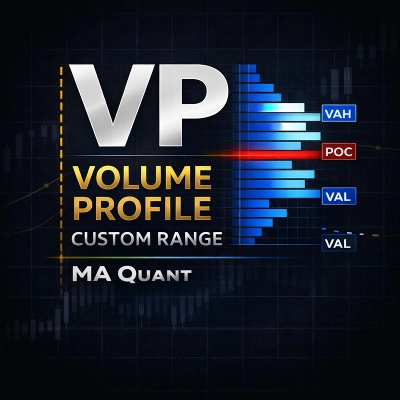
The MA Quant Volume Profile Custom Range is a trading indicator that analyzes volume distribution across the price.
Indikator
ADX
ATR
+5
Configure, simulate, and analyze trading strategies with custom filters, multi-target exits, and detailed performance me
Indikator
VWAP
Anchored VWAP Buttons
Indikator
Supply & Demand
Support & Resistance
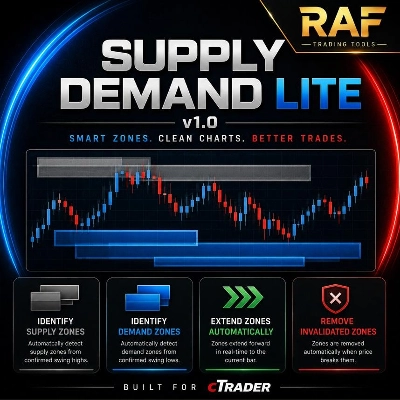
RAF Supply Demand Lite v1.0 automatically detects clean Supply and Demand zones using confirmed swing highs and lows. Zo
Indikator
RSI
Forex
+4
😎Read the description before purchasingπŸ’©
Indikator
Signal
Dark Poll Signal Indicator.liquidity leakage,precedes the great movement, accumulation, distribution
Logo "Swing Points"
Dinilai teratas
4.5
(6)
$19
Indikator
AI
SMC
+15
Multi-Timeframe Swing Points Indicator for cTrader that identifies swing highs and lows on both the current timeframe.
Indikator
Key Levels
Liquidity Grab
+2
The levels you mark each morning, drawn and followed: PDH/PDL, weekly, monthly, sessions, equal highs/lows.
Indikator
Signal
Supertrend
Multi-symbol multi-timeframe SuperTrend panel with watchlist, one-click jump, and alerts.

Harga

Sejak 11/01/2025
14.87M
Volum yang didagangkan
1.06M
Pip dimenangi