
Açıklama
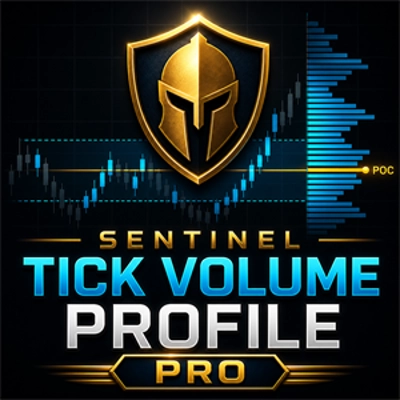
Sentinel Tick Volume Profile Free, mevcut grafik tik-hacim verilerini görsel bir fiyat dağılım profiline dönüştüren ticaret dışı bir cTrader göstergesidir. Seçilen grafik aralığında tik aktivitesinin nerede yoğunlaştığını anlamalarına yardımcı olmak için manuel tüccarlar için tasarlanmıştır.
Gösterge üç ana adımda çalışır:
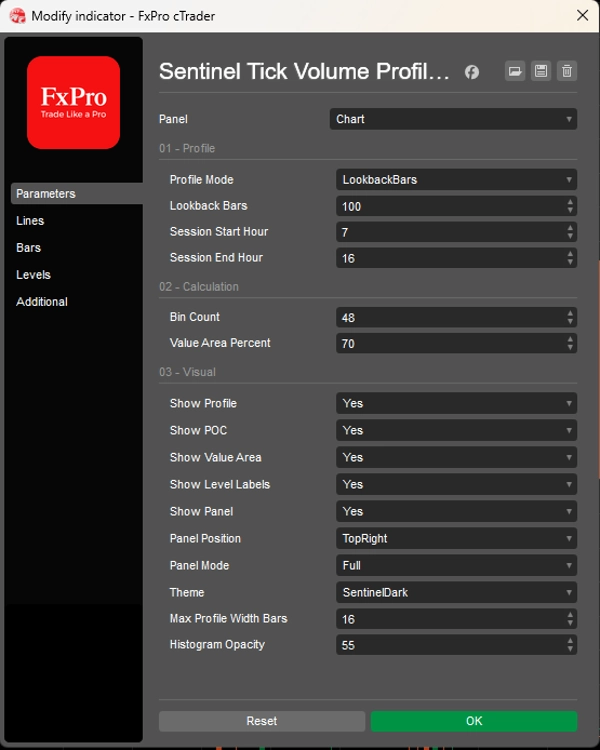
1. Profil Aralığını Seçin
Gösterge önce profilde hangi çubukların hesaplamaya dahil edileceğine karar verir.
İki aralık modu vardır:
Geriye Dönük Çubuklar
Sabit sayıda son grafik çubuğunu kullanır. Örneğin, Geriye Dönük Çubuklar 240 olarak ayarlanmışsa, gösterge profili grafikteki en son 240 çubuktan oluşturur.
Mevcut Oturum
Yapılandırılmış Oturum Başlangıç Saati ve Oturum Bitiş Saatini kullanır. Oturum saatleri gösterge grafik saatlerine göre yorumlanır. Gösterge aktif oturumları, tamamlanmış oturumları, önceki oturumları ve gece boyunca süren oturumları işleyebilir.
Bu aralık seçimi, profil için kullanılan fiyat alanını ve tik-hacim örneğini belirler.
2. Tik-Hacim Profilini Oluşturun
Aralık seçildikten sonra, gösterge seçilen yüksekten düşüğe fiyat aralığını yapılandırılabilir sayıda fiyat kutusuna böler.
Her çubuğun broker tik hacmi, o çubuğun yüksek-düşük aralığı tarafından dokunulan kutulara tahsis edilir.
Bu, fiyat seviyesine göre tahmini bir tik-hacim dağılımı oluşturur.
Bu dağılımdan gösterge şunları hesaplar:
Tahmini POC
En yüksek broker tik-hacim yoğunluğuna sahip fiyat kutusu.
Tahmini VAH
Tahmini değer alanının üst sınırı.
Tahmini VAL
Tahmini değer alanının alt sınırı.
Tahmini Değer Alanı
Seçilen toplam tik hacminin yüzdesini içeren tahmini POC çevresindeki alan. Varsayılan değer alanı ayarı %70'tir.
Bu değerler broker tik-hacim verilerine dayalı tahminlerdir. Bunlar borsa tarafından bildirilen hacim seviyeleri değildir.
3. Profili Grafikte Göster
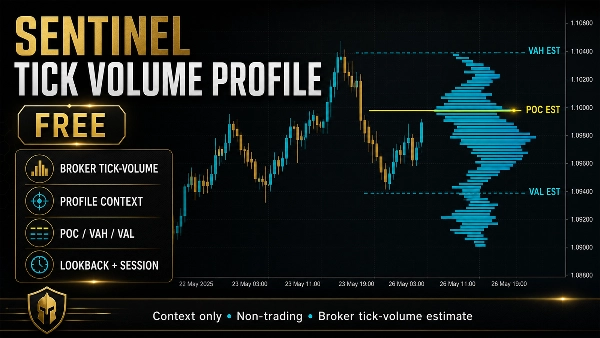
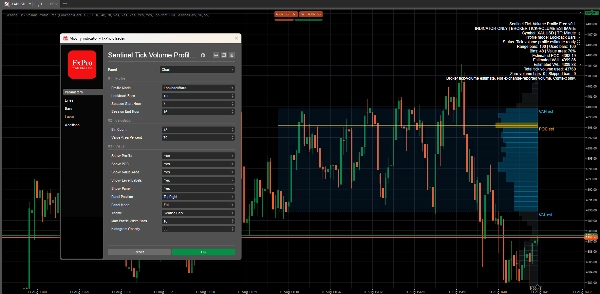
Gösterge daha sonra hesaplanan profili görsel grafik bağlamı olarak gösterir.
Şunları gösterebilir:
- Bir tik-hacim profili histogramı
- Tahmini POC çizgisi
- Tahmini VAH çizgisi
- Tahmini VAL çizgisi
- Değer alanı gölgelendirmesi
- Kompakt grafik etiketleri: Tahmini POC, Tahmini VAH ve Tahmini VAL
- Seçilen profil modu, aralık detayları, kutu sayısı, tahmini seviyeler, kullanılan toplam tik hacmi ve sınırlama metni ile bir panel özeti
Grafik etiketleri açılıp kapatılabilir. Profil, POC, değer alanı ve panel ayrıca ayrı ayrı kontrol edilebilir.
PANEL MODLARI
Gösterge üç panel modu içerir:
Tam
Aralık çubukları, kullanılan çubuklar, kutu sayısı, değer alanı yüzdesi, tahmini POC, tahmini VAH, tahmini VAL, kullanılan toplam tik hacmi, sıfır hacimli çubuklar, atlanan çubuklar ve broker tik-hacim sınırlaması dahil en eksiksiz bilgileri gösterir.
Kompakt
Mod, kutu sayısı, durum, tahmini POC ve değer alanı aralığı ile daha kısa bir özet gösterir.
Minimal
Tahmini POC ve sadece bağlam sınırlamasına odaklanan çok kompakt tek satırlık bir durum gösterir.
Önemli Veri Sınırlaması
Sentinel Tick Volume Profile Free, grafikten broker tik-hacim verilerini kullanır. Borsa tarafından bildirilen hacim, vadeli işlem hacmi, footprint verisi, delta, bant verisi veya kurumsal emir akışı verisi kullanmaz.
Bu nedenle profil, broker tik-hacim profili tahmini olarak en iyi şekilde anlaşılmalıdır.
Değerler broker, sembol, zaman dilimi, oturum ve mevcut grafik geçmişine bağlı olarak değişebilir.
Gösterge Yapmadığı Şeyler
Sentinel Tick Volume Profile Free emir vermez, pozisyonları değiştirmez, işlemleri kapatmaz, işlemleri yönetmez veya cBotları kontrol etmez.
Alım sinyalleri, satım sinyalleri, giriş onayı, işlem talimatları, piyasa tahminleri, kazanma oranı tahminleri, performans öngörüleri veya kârlılık iddiaları sağlamaz.
Sadece manuel görsel bağlam aracıdır.
Özet
The indicator divides the high-to-low price range of the selected bars into configurable price bins, allocating tick volume across these bins to estimate volume distribution by price level. It calculates key estimated levels including the Point of Control (POC)—the price bin with the highest tick volume concentration—along with the Value Area High (VAH), Value Area Low (VAL), and the Value Area itself, which by default covers 70% of total tick volume.
The profile is displayed visually on the chart with options to show a histogram, estimated POC, VAH, VAL lines, value-area shading, and compact labels. A panel provides summary information in three modes (Full, Compact, Minimal) detailing profile parameters and volume data. The indicator uses broker tick-volume data only and does not execute trades or provide trading signals. It serves as a manual visual tool to enhance market context understanding.




!["High-Low Divergence [Iridio Capital]" logosu](https://cdn.ctrader.com/image/webp/10a9e91b-243a-43f6-bbfe-7376bad5a214_61554)









!["[CB] Pivot Points Pro" logosu](https://cdn.ctrader.com/image/webp/43463c82-67b0-4f10-a4ba-901bba091d81_32594)

