
Ichimoku Cloud Indicators for cTrader
Compare Ichimoku Cloud indicators for cTrader designed for trend, support, resistance and momentum analysis. These forex tools help traders assess market direction, pullbacks, breakouts and confirmation zones in one visual framework.
Инструменты
Сравнение инструментов
Частые вопросы
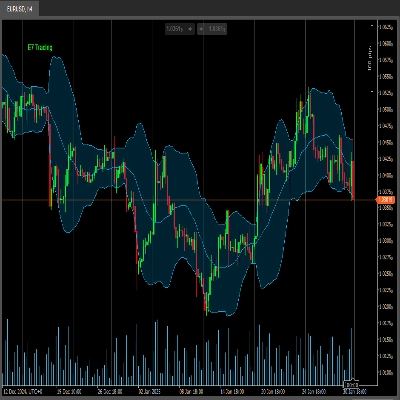
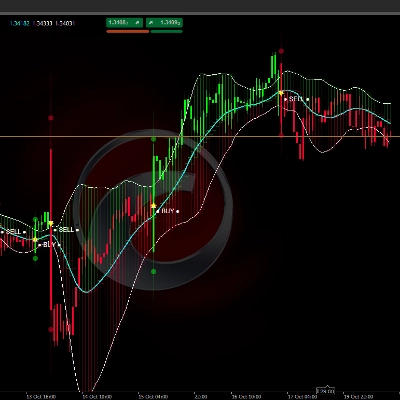
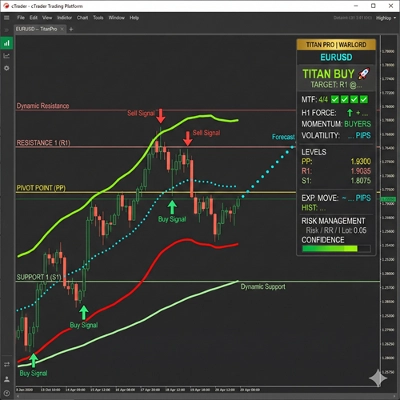
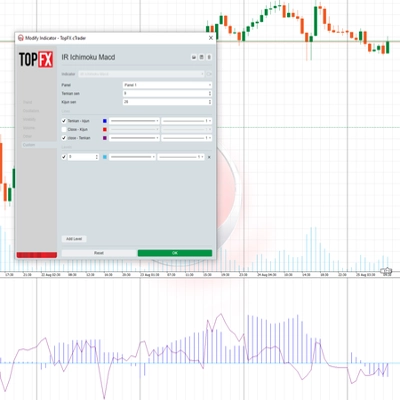
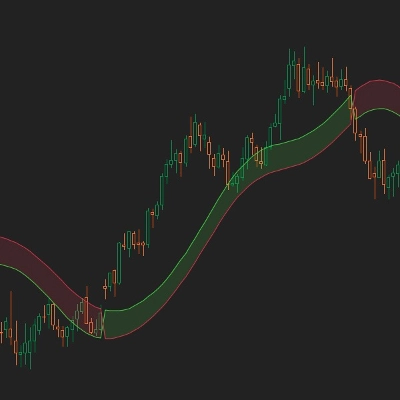

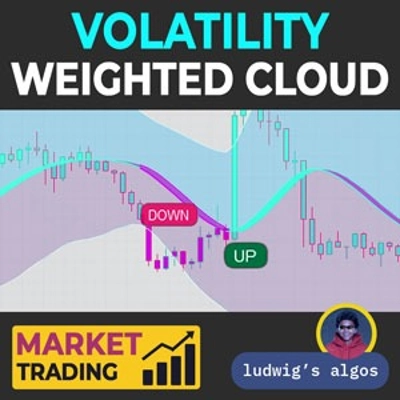
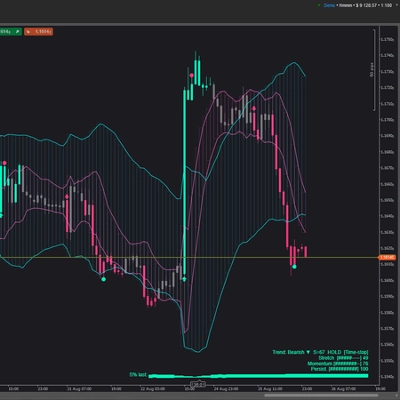
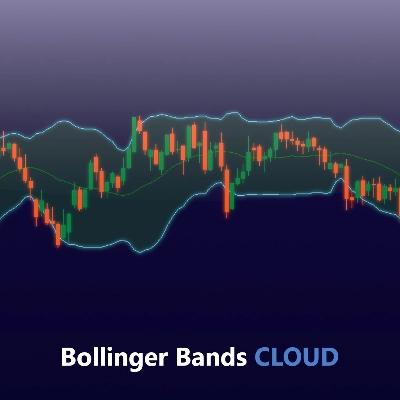
Сравнение инструментов
Продукт | Отзывы | Скачивания | Продажи | Цена | Совместимость с платформами |
|---|---|---|---|---|---|
E7 Indicators Free Overlays | 5.0 (2) | 454 | — | Бесплатно | Windows, Mac |
ScalpingSignalIndicator | 5.0 (3) | — | 9 | $75 | Windows, Mac |
Signals Volatility Cloud Breakout | — | 360 | — | Бесплатно | Windows, Mac |
Titan Pro | 4.3 (3) | — | 6 | $19 | Windows, Mac |
IR Ichimoku Macd | 5.0 (1) | 245 | — | Бесплатно | Windows, Mac |
Half Trend Cloud BT | 4.5 (2) | — | 6 | $40 | Windows, Mac |
Ichimoku Cloud Indicator | — | 221 | — | Бесплатно | Windows, Mac |
SSL Channel | 4.5 (4) | — | 3 | $19 | Windows, Mac |
dark-cloud | — | 198 | — | Бесплатно | Windows, Mac |
EMA MTF TREND | 4.5 (2) | — | 2 | $20 | Windows, Mac |
Donchian Flux Cloud | 5.0 (1) | 196 | — | Бесплатно | Windows, Mac |
SmartBot-Tenkan & ATR Indicator | 4.5 (2) | — | 2 | $19 | Windows, Mac |
RSI Advanced | 5.0 (4) | — | 1 | $20 | Windows, Mac |
Volatility Weighted Cloud by LudwigICT | 4.0 (2) | — | — | $49 | Windows, Mac |
TrendStrengthSignals | 4.7 (3) | — | — | $19 | Windows, Mac |
Bollinger Bands Cloud | 4.4 (5) | — | — | $19 | Windows, Mac |
Частые вопросы
Ichimoku Cloud, or Ichimoku Kinko Hyo, is a trend system of five lines: Tenkan-sen, Kijun-sen, leading spans Senkou A and B, and the lagging Chikou span. The shaded area between the two leading spans, shifted ahead of price, forms the cloud itself.
Those classic settings come from an era of six-day trading weeks, so some traders lengthen them for round-the-clock crypto or adjust them for intraday charts. The conversion, base and slow leading lines are midpoints of the high-low range over those periods, so longer settings slow most signals.
Price above the cloud is usually read as a bullish bias, below it as bearish, and inside it as an undecided or ranging market. Chartists often look for agreement from the Tenkan-Kijun cross and the lagging span; the indicator draws these lines but places no trades.
In sideways markets price cuts back and forth through a thin cloud, and the line crosses produce frequent false signals. Every line comes from past highs, lows or closes, so the forward-shifted cloud is old data displayed ahead, not a forecast, and trades based on it can lose.
They differ in features and terms: a paid version may add alerts, multi-timeframe clouds or signal markers, and some sellers offer a limited trial. The product page states price and conditions, and every version needs the Windows or Mac edition of cTrader.