
Description
🚀 10,000+ traders already use our TOP indicators🏆
👉 Get all our TOP systems here:
_______________________________________________
📌 Market Structure Indicators
· ✅ AdvancedMarket Structure: Bos, Choch, SwinLevels, Order Blocks, Market Structure& Liquidity Finder
· 🔄 Dynamic Market StructureAnalysis of Turning Points
· 🧱 Order Block
· ⚖️ Market Imbalance
· ⛓️ BOS & CHOCH
· 🧠 ICT Power of 3
_______________________________________________
🔚 Smart Exit Systems
_______________________________________________
📐 ZigZag Indicators
· 🔍 ZigZag Price LiquidityProjection
· ➖ ZigZag
_______________________________________________
🧱 Support & Resistance Indicators
· 🟩 SmartTrend Support &Resistance Lines
· 🧱 All Support and ResistanceLevels
_______________________________________________
📊 Trend & Channel Indicators
· 📊 Supertrend
_______________________________________________
💧 Volume & Liquidity Tools
_______________________________________________
⚡ Momentum & RSI Indicators
· 🔎 Multi-Level Candle Bias
Tracker
_______________________________________________
🔮 Prediction & Projection Tools
· 📐 Prediction Based on Linreg& ATR
· 📏 Fibonacci Linear RegressionMulti-timeframe
· 📈 Volume-Powered Market Flow Projector
________________________________________________________________________________________
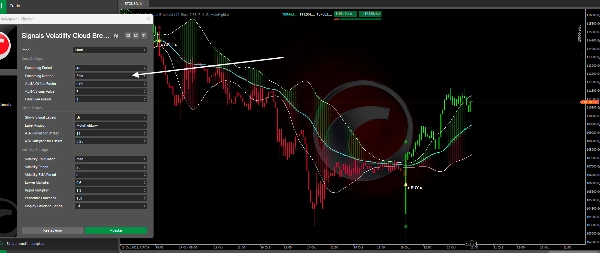
SIGNALS VOLATILITY CLOUD BREAKOUT.
General Overview 💡
Adaptive Trend Bands is an advanced trend-following indicator that combines adaptive price filtering with dynamic volatility bands. Unlike traditional static band indicators, this system automatically adjusts its sensitivity according to changing market conditions, providing more accurate signals in different volatility environments. 🎯
What Does This Indicator Do? 🤔
The indicator generates a filtered and smoothed representation of the price (OHLC) that eliminates market noise, allowing the underlying trend to be visualized with greater clarity. Simultaneously, it calculates upper and lower bands that automatically expand or contract based on current volatility, adapting to calm or turbulent markets. 🌊
Key Features: ✨
- Adaptive price filtering using ALMA or EMA algorithms
- Volatility bands that dynamically adjust using historical percentiles
- Visual BUY/SELL signals when the price crosses the bands 🟢🔴
- Candle coloring based on the detected trend (green bullish / red bearish)
- Color clouds between the filtered lines to visualize the trend strength 💪
How Does It Work? ⚙️
Filtering System
The indicator applies a two-stage smoothing process to the price:
- First Layer: Uses ALMA (Arnaud Legoux Moving Average) or traditional EMA filters to eliminate short-term fluctuations. ALMA is especially effective because it reduces lag while maintaining smoothness.
- Second Layer: Applies an additional EMA smoothing to the result of the first filter, creating an ultra-smooth trend line that reacts in a balanced way to price changes.
Adaptive Volatility Calculation 📏
The system measures market volatility using two methods:
- Standard Deviation (StdDev): Classic dispersion measurement method
- Mean Absolute Deviation (MAD): More robust against extreme values
The calculated volatility is smoothed and then compared to a history of past volatilities to determine its percentile rank. This percentile controls the band multiplier:
- Low Volatility (low percentile): Bands are tighter to the price 🤏
- High Volatility (high percentile): Bands are wider, giving room for movement 🌐
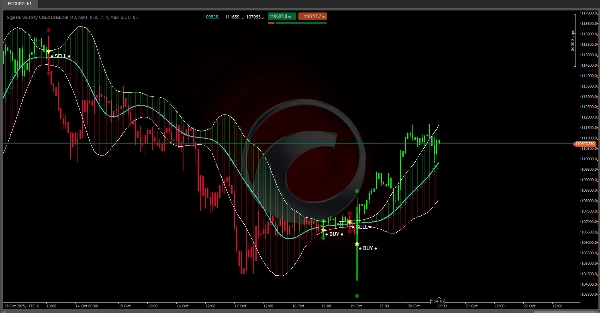
Signal Generation 🔔
Signals are activated when the actual price crosses the adaptive bands:
- Once a signal is activated, the indicator maintains the trend status until the opposite cross occurs, preventing premature signals in consolidation zones. 🛡️
What Is It Used For? 🛠️
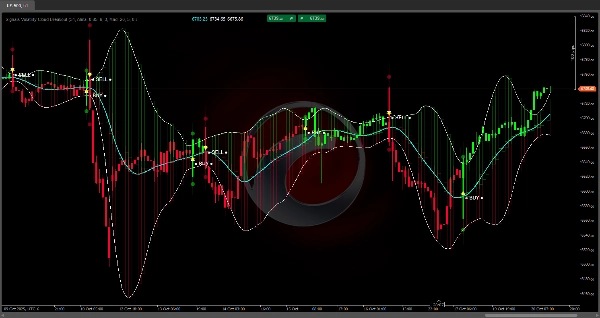
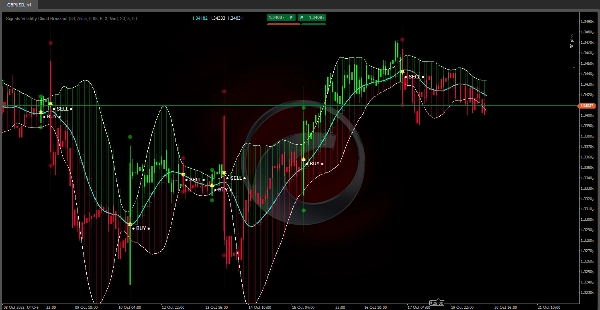
Trend Identification 👀
The indicator colors the candles according to the direction of the detected trend, allowing you to quickly identify whether the market is in a bullish or bearish phase. The color clouds between the filtered lines visually reinforce the strength and direction of the movement.
Entry and Exit Points ➡️🚪
The BUY/SELL signals marked with prominent icons indicate potential moments to enter or exit the market. These signals seek to capture the start of trends when the price shows enough momentum to overcome the adaptive bands.
Position Management 💼
The upper and lower bands act as reference levels for:
- Determining dynamic stops
- Identifying relative overbought/oversold zones 🏷️
- Assessing if a trend is losing strength (price retracing toward the central line) 📉
Summary
Key features include visual BUY/SELL signals triggered when price crosses the adaptive bands, candle coloring to indicate bullish or bearish trends, and colored clouds between filtered lines to represent trend strength. The bands also serve as dynamic reference levels for setting stops, identifying overbought or oversold conditions, and assessing trend strength. This indicator supports various markets including Forex, Crypto, Stocks, and symbols such as BTCUSD, EURUSD, GBPUSD, XAUUSD, and USDJPY. It is intended for trend identification, entry and exit timing, and position management within diverse trading environments.


