
説明
価格の混乱を正確な回帰数学で明確なトレンドチャネルに変換します。
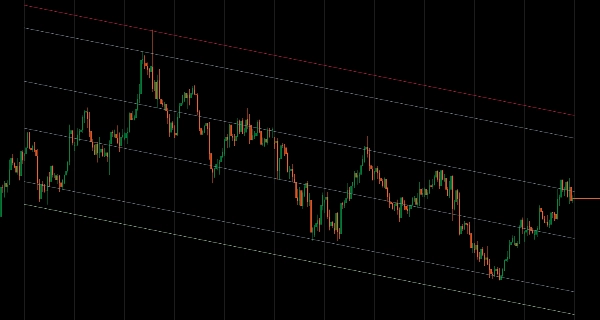
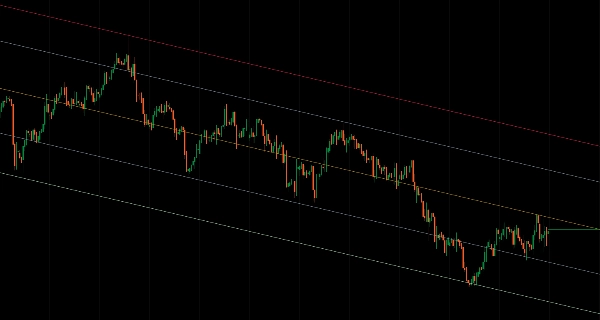
回帰チャネルは、選択した価格データに線形回帰線を計算し、価格の偏差に基づいて上下の境界線を描画します。これにより、トレンドの方向性と潜在的な反転ゾーンを統計的に根拠のある視点で把握できます。
最適な用途
- 客観的なトレンド定義を求める構造トレーダー
- 買われ過ぎ・売られ過ぎの極端値を特定する平均回帰トレーダー
- チャネルの違反やモメンタムの変化を見つけるブレイクアウトトレーダー
- マルチタイムフレーム分析 - 日足チャートに月次回帰をプロットしてコンテキストを把握
主な特徴
- 柔軟なデータ選択
-
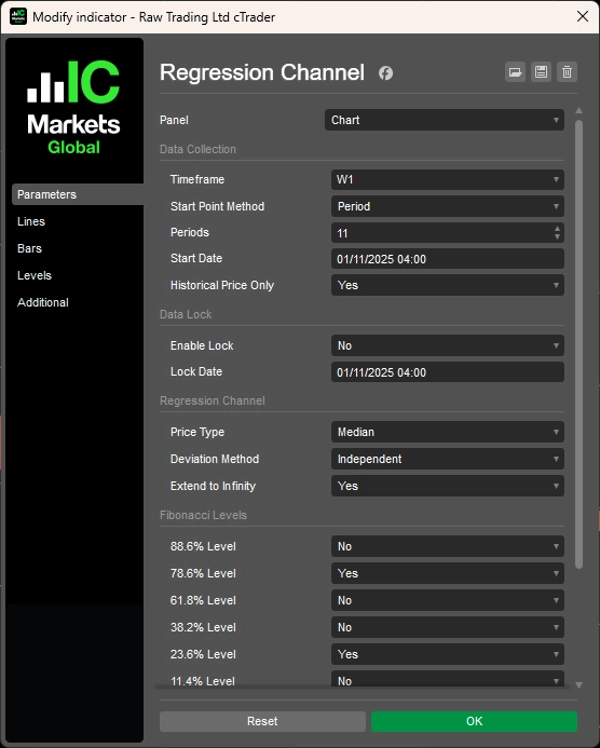
- 期間モード:直近N本のバーを分析(例:直近12本の月足ローソク足)
- 日時モード:特定の市場イベントや日付から開始
- ロック機能:価格が継続する中、過去のポイントで分析を固定
- マルチタイムフレーム:現在のチャート上で任意の時間軸から回帰を描画
- スマートな偏差方法
-
- 平均:平均偏差を用いたバランスの取れたレベル(トレーディングゾーンに最適)
- 独立:方向性のボラティリティに適応する非対称チャネル
- 最大:全範囲分析のための極端な価格境界を表示
- プロフェッショナルツール
-
- 6つのフィボナッチリトレースメントレベル(11.4%、23.6%、38.2%、61.8%、78.6%、88.6%)
- 6種類の価格タイプ:始値、高値、安値、終値、中央値、典型値
- 履歴のみモード:安定したバックテストのために形成中のバーを除外
- 長期予測のための無限延長オプション
- 完全な色のカスタマイズ
際立つ理由
基本的な回帰ツールとは異なり、このインジケーターはあなたにコントロールを提供します。特定のイベント後の価格の動きを研究するために分析をロックします。対称チャネルと非対称チャネルを切り替えます。上位時間軸の構造と下位時間軸の実行を組み合わせ、信頼性のためにクリーンで効率的なコードで構築されています。
クリーンなチャート。明確な構造。自信のある決断。
概要
インジケーターのプロフィール
カスタマーレビュー
0.0
レビュー: 0
カスタマーレビュー
この商品にはまだレビューがありません。お使いになったことがある方は、ぜひレビューをお願いします。
ディスカッション
よくあるご質問
Fibonacci
cTrader Storeで入手可能な取引ボット、インジケーター、プラグインなどの商品は、第三者の開発者が提供するものであり、情報と技術の取得のみを目的としてご利用いただけます。cTrader Storeはブローカーではなく、投資助言や個人的な推奨を行うことも、将来のパフォーマンスを保証することもありません。


価格
登録日 20/12/2024
8.27K
無料インストール