present
Zarejestruj się i otrzymaj 50 $ zniżki na pierwszy zakup
Trading product for CQL Trend Strength Index Wskaźnik Premium/Discount  Supertrend, image 1
CQL Trend Strength Index
Wskaźnik
63 pobrania
Wersja 1.1, Aug 2026
Windows, Mac
Trading product for CQL Trend Strength Index Wskaźnik Premium/Discount  Supertrend, image 2
Trading product for CQL Trend Strength Index Wskaźnik Premium/Discount  Supertrend, image 3
Trading product for CQL Trend Strength Index Wskaźnik Premium/Discount  Supertrend, image 4
Trading product for CQL Trend Strength Index Wskaźnik Premium/Discount  Supertrend, image 5
36.24K
Wolumen transakcji
336
Zysk w pipsach
2
Sprzedaż
63
Bezpłatne instalacje

Opis

Co analizuje

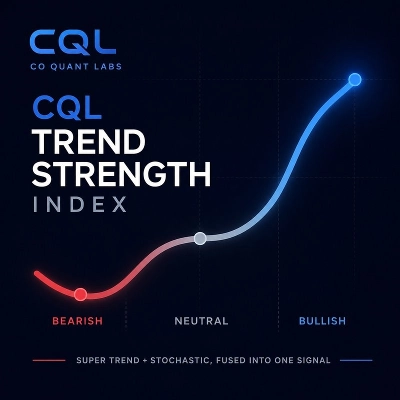
Indeks Siły Trendu CQL łączy Supertrend i Stochastic w jeden zintegrowany sygnał zamiast uruchamiać je jako dwa oddzielne narzędzia na wykresie. Odczytuje kierunek ceny wraz z momentum i klasyfikuje aktualne warunki rynkowe do jednego z trzech stanów: Silny Kup, Silna Sprzedaż lub Konsolidacja.

Jak interpretować sygnał

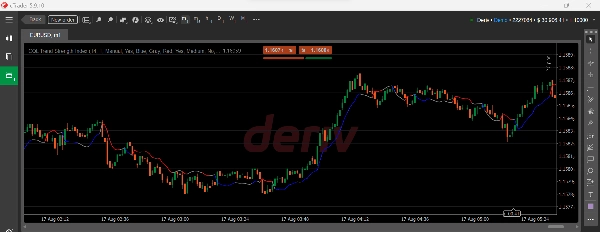
Wskaźnik rysuje pojedynczą wygładzoną linię bezpośrednio na cenie. Jej kolor mówi wszystko na pierwszy rzut oka:

  • Niebieski oznacza Silny Kup. Cena i momentum potwierdzają byczą siłę.
  • Czerwony oznacza Silną Sprzedaż. Cena i momentum potwierdzają niedźwiedzią siłę.
  • Szary oznacza Konsolidację. Momentum znajduje się w strefie neutralnej, sygnalizując niską pewność niezależnie od kierunku ceny.

To narzędzie kontekstowe trendu, a nie generator sygnałów wejścia. Informuje o charakterze aktualnego rynku, abyś mógł stosować własną metodę wejścia z lepszą świadomością, czy handlujesz z silnym trendem, czy w konsolidacji.

Kluczowe ustawienia i parametry

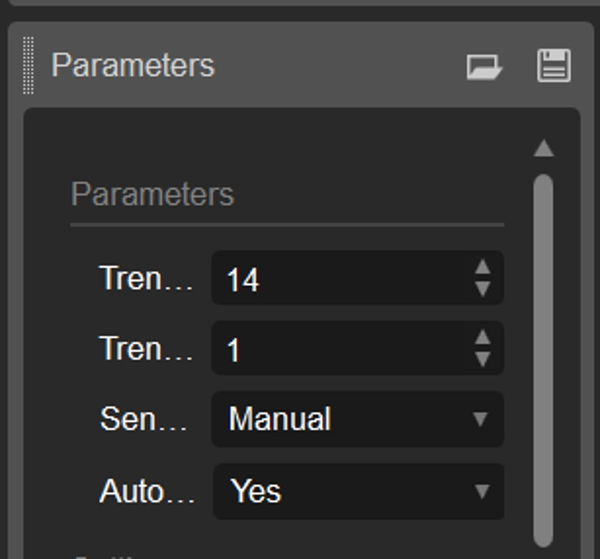
  • Okres Trendu i Reaktywność Trendu dają pełną kontrolę nad tym, jak szybko lub wolno wskaźnik reaguje
  • Wstępna czułość (Wolna, Średnia, Szybka, Ręczna) pozwala szybko dostroić wskaźnik bez zmiany surowych liczb
  • Automatyczne dopasowanie do interwału czasowego dostosowuje czułość automatycznie na podstawie wykresu
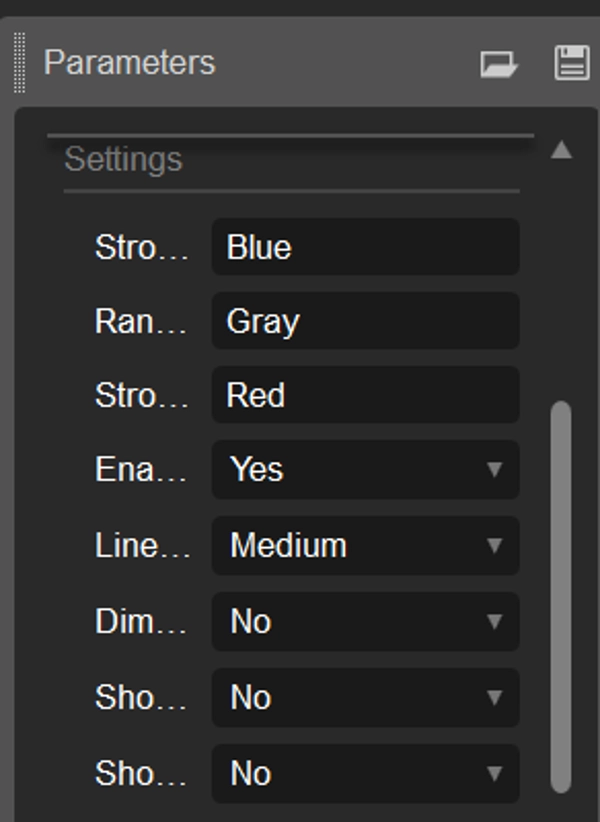
  • Zakładka ustawień obejmuje pełną personalizację kolorów, grubość linii, etykiety stanów, zabarwienie tła strefy oraz opcję resetu do domyślnych ustawień

Typowe zastosowania

  • Szybkie potwierdzenie, czy rynek jest silnie trendujący przed szukaniem wejść innym narzędziem lub metodą
  • Filtrowanie warunków konsolidacji lub niestabilnych, gdzie strategie podążania za trendem zwykle zawodzą
  • Szybki wizualny odczyt zdrowia trendu bez interpretowania dwóch oddzielnych wskaźników

Dla kogo jest to narzędzie

Dla traderów, którzy mają już metodę wejścia, manualną lub zautomatyzowaną, i chcą mieć szybki, niezawodny filtr kontekstu trendu nałożony na to. Odpowiednie dla traderów swingowych działających dyskrecjonalnie oraz tych budujących systemy oparte na regułach, którzy potrzebują czystej klasyfikacji trendu versus brak trendu.

Ograniczenia i uwagi dotyczące użytkowania

  • To wskaźnik kontekstu trendu, a nie sygnał kupna lub sprzedaży. Nie przewiduje odwróceń ani nie generuje wejść do transakcji
  • Jak wszystkie narzędzia podążające za trendem, będzie opóźniony na początku nowego trendu i może pozostawać w stanie Konsolidacji podczas wybicia o niskim momentum
  • Najlepiej używać go wraz z własnym zarządzaniem ryzykiem i potwierdzeniem wejścia, a nie jako samodzielny system handlowy

Podsumowanie

Podsumowanie AI
The CQL Trend Strength Index is a technical indicator that combines Supertrend and Stochastic signals into a single, smoothed line plotted directly on the price chart. It classifies market conditions into three states: Strong Buy (blue), Strong Sell (red), or Ranging (gray), reflecting the combined analysis of price direction and momentum. This indicator serves as a trend context tool, helping traders quickly assess whether the market is trending strongly or moving sideways, rather than generating specific trade entry signals.

Key features include adjustable Trend Period and Reactivity settings, sensitivity presets (Slow, Medium, Fast, Manual), and automatic adaptation to the chart’s timeframe. Users can customize colors, line thickness, labels, and background zone tinting. Typical use cases involve confirming strong trends before applying entry methods, filtering out ranging conditions where trend-following strategies may underperform, and obtaining a clear visual read of trend health without managing multiple indicators.

Designed for traders with existing entry strategies, it supports discretionary and rule-based trading by providing a reliable trend versus no-trend classification. The indicator requires integration with personal risk management and entry confirmation techniques and is intended for use across various markets where price bars are available.
Profil wskaźnika
Kategoria wskaźnika
Trend
Typ wyjścia
Wizualizacja
Wymagania dotyczące danych
Tylko słupki
Obsługiwane sygnały
Siła trendu

Opinie klientów

0.0
Opinie: 0
Opinie klientów
Ten produkt nie ma jeszcze opinii. Wypróbowałeś(-aś) go już? Bądź pierwszy(-a) i powiedz o tym innym!

Dyskusja

Częste pytania

Premium/Discount
Supertrend
MSS
Stochastic
Produkty dostępne za pośrednictwem cTrader Store, w tym boty handlowe, wskaźniki i wtyczki, dostarczane są przez deweloperów zewnętrznych i udostępniane wyłącznie w celach informacyjnych oraz w celu zapewnienia dostępu technicznego. cTrader Store nie jest brokerem i nie zapewnia doradztwa inwestycyjnego, nie udziela spersonalizowanych rekomendacji ani nie gwarantuje przyszłych wyników.

Więcej od tego autora

Logo „Vix75 Shield”
Statystyki na żywo
2.0
(1)
$85
/
$150
cBot
Forex
Crypto
+4
Stay on the right side of every major move on the Volatility 75 Index, automatically. No charts, no decisions.
7.6%
ROI
2.6
Współczynnik zysku

Możesz także polubić

Wskaźnik
🎯 Order Block Detector - Smart Trading: Identifica bloques de órdenes clave en cTrader para un trading más inteligente.
Wskaźnik
ATR
RSI
+4
Adaptive Ichimoku with nine-factor confluence scoring, five signal types, smart TP/SL and an MTF panel.
Wskaźnik
Forex
The cTrader Market Sessions Alerts Indicator marks global sessions, highlights key levels, and sends real-time alerts.
Wskaźnik
Forex
BTCUSD
+12
Pro Structure Patterns Detector
Logo „Oscillator Scanner”
Najwyżej oceniane
4.7
(4)
$20
/
$39
Wskaźnik
ATR
RSI
+7
Track the Movement of Market Assets with an Oscillator Scanner in Real-Time!
Wskaźnik
SMC
Pro Volume Profile with Delta, Session Filters & CSV Export. Precision order flow analysis.
Wskaźnik
ZigZag
Indices
+2
Auto Trendlines, Fibonacci, Pitchfork and Patterns from non‑repainting pivots. One‑click Presets, targeted Alerts, and a
Wskaźnik
ATR
RSI
+18
Breakout SMA by SLA is a trend-filtering tool designed to enhance the ORB SLA framework.
Wskaźnik
AI
SMC
+14
Refined cleaner version of Key Levels indicator with broker UTC offset, styles & label alignment.
Wskaźnik
Forex
BTCUSD
+10
Automate your price action analysis with stable, time-anchored Support & Resistance zones that adapt to breakouts in rea
Wskaźnik
ATR
BOS
+5
Clean Smart Money zones with filtered FVGs, confirmed BOS, Order Blocks, and automatic mitigation tracking.
Wskaźnik
ATR
EMA
+2
Eight-EMA ribbon with ATR trade zones, a nine-symbol screener and a five-timeframe trend dashboard.
Wskaźnik
Forex
Customizable multi-timeframe pivot point indicator for cTrader with alerts, Fibonacci, CPR, and more!
Wskaźnik
RSI
Forex
+4
New version of one of my favorites includes Fibonacci and moving average convergence divergence lines
Wskaźnik
Forex
Crypto
+6
Smart Price Action Scanner 🔍 Detects engulfing, pin bars & inside bars with trend filter for cleaner entries ✅
Wskaźnik
RSI
Breakout
+1
"Identify key market zones and visualize support/resistance from multiple timeframes on a single chart.
Wskaźnik
Prop
Forex
+5
Transform your approach to trading with our innovative Pivot Point Indicator.
Wskaźnik
ATR
Volume
+3
Fibonacci trend signals on closed bars, with an ATR stop, up to four targets and a break-even ladder.

Cena

36.24K
Wolumen transakcji
336
Zysk w pipsach
2
Sprzedaż
63
Bezpłatne instalacje