
Descrição
Indicador Profissional Footprint & Delta para cTrader
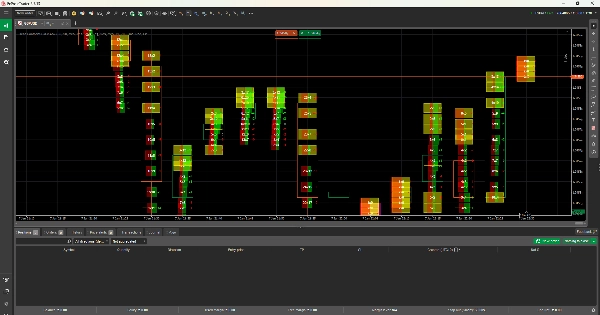
Este Indicador Footprint para cTrader lê dados reais de ticks para mostrar como compradores e vendedores interagem em cada nível de preço. Ele exibe volume, delta bid/ask e desequilíbrios, ajudando os traders a ver claramente quem está no controle do mercado.
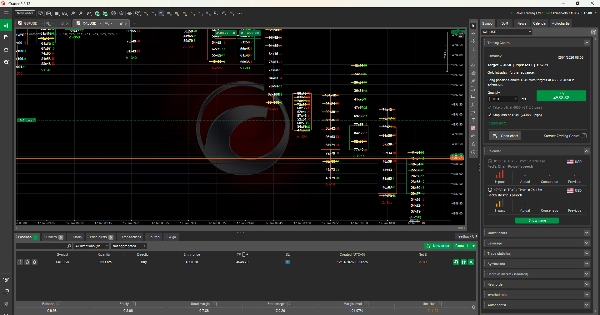
Construído usando conceitos de Market Profile e Volume Profile, o indicador destaca áreas de alta atividade, zonas de valor e suporte ou resistência fortes. Em vez de adivinhar apenas pelo preço, os traders podem tomar decisões baseadas em volume real negociado e fluxo de ordens.
Perfeito para scalping e trading intradiário, esta ferramenta oferece aos usuários do cTrader uma vantagem profissional ao revelar a verdadeira história por trás do movimento do preço.
Este indicador ajuda você a entender o que realmente acontece dentro de cada candle. Ele lê dados de ticks e mostra quantos compradores e vendedores negociaram em cada preço.
Você pode ver claramente:
- Onde os compradores são mais fortes
- Onde os vendedores são mais fortes
- Quando o momentum está aumentando ou desacelerando
O indicador também mostra delta, que significa a diferença entre a pressão de compra e venda. Ele é construído usando Market Profile e Volume Profile, para que você possa identificar facilmente áreas importantes de preço onde o mercado reage.
Isso torna o trading mais fácil para iniciantes porque você não precisa adivinhar. Você pode ver volume real e atividade real do mercado, não apenas indicadores baseados no preço.


