present
가입하고 첫 구매 시 $50 할인을 받으세요
Trading product for Revenge Trading Detector 지표 BTCUSD Forex, image 1
Revenge Trading Detector
지표
버전 1.0, Apr 2026
Windows, Mac
4.6
리뷰: 3
Trading product for Revenge Trading Detector 지표 BTCUSD Forex, image 2
Trading product for Revenge Trading Detector 지표 BTCUSD Forex, image 3
12.28M
거래량
31.27K
핍 수익

설명

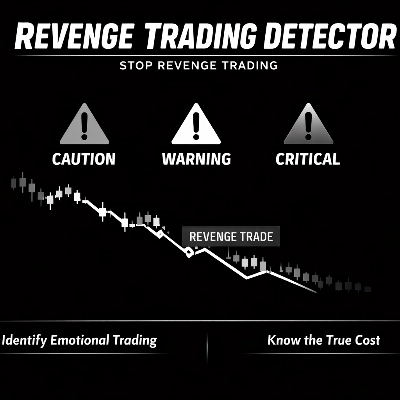
복수 거래 감지기는 실시간 거래 활동을 모니터링하며 감정이 아닌 전략이 거래 결정을 주도하는 순간을 자동으로 식별합니다. 대부분의 트레이더는 복수 거래가 어떤 느낌인지 알고 있습니다. 이 지표는 복수 거래가 당신에게 정확히 어떤 비용을 초래하는지 보여줍니다.


---


분석 내용


이 지표는 실시간으로 거래 내역을 관찰하며 새로운 포지션이 열릴 때마다 세 가지 조건을 확인합니다:

- 이전 거래가 손실로 종료되었나요?

- 새로운 포지션이 그 종료 후 10분 이내에 열렸나요?

- 새로운 포지션 크기가 이전 것보다 큰가요?


세 가지 조건이 모두 동시에 충족되면 복수 거래로 표시됩니다. 또한 이 지표는 지난 30일간의 전체 거래 내역을 스캔하여 이 패턴의 모든 과거 사례를 식별합니다.


---


신호 및 시각 요소


경고는 손실 규모, 새로운 거래가 열리는 속도, 포지션 크기 증가량에 따라 세 가지 심각도 수준으로 분류됩니다:


주의 (노란색) - 하나 이상의 경고 신호가 있습니다. 속도를 줄이고 계획을 검토하세요.

경고 (주황색) - 명확한 복수 거래 패턴이 감지되었습니다. 계속하기 전에 잠시 멈추세요.

위험 (빨간색) - 고심각도 패턴입니다. cTrader를 닫고 30분 후에 다시 접속하세요.


모든 경고는 차트에 직접 표시됩니다. 지속적인 통계 패널에는 다음이 표시됩니다:

- 지난 30일간 복수 거래로 인한 총 손실 금액

- 복수 거래 승률과 일반 거래 승률의 나란한 비교

- 전체 종료 거래 중 복수 거래의 비율


---


주요 설정 및 매개변수


복수 창(분) - 손실 후 새로운 거래가 열려야 하는 최대 시간. 기본값: 10.

통계 기간(일) - 패널이 조회하는 기간. 기본값: 30.

트리거 최소 손실 - 이 임계값 이하의 작은 손실은 무시합니다. 기본값: 0.

패널 위치 - 차트 내 통계 패널 위치 지정(상/중앙/하, 좌/중앙/우).

사운드 알림 - 트리거 시 선택적 .wav 파일 알림.

위험 배너 - 최고 심각도 경고를 위한 전체 화면 배너.


---


일반적인 사용 사례


- 손실 연속 구간을 경험하는 외환, 금 또는 지수의 활발한 당일 거래자

- 한 번의 나쁜 세션으로 도전이 종료되는 자금 지원 계좌 도전 중인 트레이더

- 복수 거래가 결과에 악영향을 미친다고 의심하지만 확인할 데이터가 없는 사람

- 저널이나 성과 검토 과정을 사용하는 트레이더로 자동 패턴 감지를 원하는 경우


---


적합 대상


이 지표는 초보자가 규율을 배우는 단계부터 경험 많은 트레이더가 자신의 행동을 객관적으로 점검하고자 할 때까지 모든 경험 수준의 활발한 개인 투자자를 위해 설계되었습니다. 특히 감정적 결정이 큰 영향을 미치는 프로프 펌 트레이더에게 매우 유용합니다.

요약

AI 요약
The Revenge Trading Detector is an indicator designed to monitor live trading activity and identify revenge trades in real time. It analyzes trade history by checking three conditions each time a new position is opened: whether the previous trade closed at a loss, if the new position was opened within 10 minutes of that loss, and if the new position size is larger than the previous one. When all conditions are met, the trade is flagged as a revenge trade. The indicator also reviews the past 30 days of trading to detect historical instances of this pattern.

Alerts are categorized into three severity levels—Caution, Warning, and Critical—based on loss size, timing, and position size increase. These alerts appear directly on the chart, accompanied by a persistent statistics panel displaying total losses from revenge trades over 30 days, win rates comparison between revenge and normal trades, and the proportion of revenge trades among all closed trades.

Key customizable settings include the revenge window duration, statistics period, minimum loss threshold, panel position, sound alerts, and critical alert banners. The indicator is suitable for active intraday traders across markets such as forex, commodities, indices, stocks, and cryptocurrencies, and is particularly useful for traders managing funded accounts or seeking objective behavioral insights.
지표 프로필
지표 카테고리
통계
출력 유형
신호
데이터 요구 사항
외부 데이터
막대만

상담

고객 리뷰

4.6
리뷰: 3
5
67 %
4
33 %
3
0 %
2
0 %
1
0 %
고객 리뷰
April 15, 2026
20 signals is a fair first sample, and it reduces the urge to click every setup.
April 9, 2026
It becomes more useful when the signal gets compared with context. Price action still has to agree.
April 2, 2026

자주 묻는 질문(FAQ)

BTCUSD
Forex
Indices
EURUSD
Commodities
GBPUSD
NZDUSD
Prop
Crypto
Stocks
XAUUSD
NAS100
USDJPY
트레이딩 봇, 지표, 플러그인 등 cTrader Store에서 제공되는 상품은 제3자 개발자에 의해 제공되며, 이는 단순히 정보 및 기술적 접근을 목적으로 제공된 것입니다. cTrader Store는 중개인이 아니며, 투자 조언, 개인별 추천 또는 향후 성과에 대한 어떠한 보장도 제공하지 않습니다.

좋아하실 만한 다른 항목

지표
Breakout
Allow trader to visualize Support & Resistance across different timeframes,give trader an overview of the current market
지표
Volume
Key Levels
View tick activity across a selected chart range with Point of Control, Value Area High and Value Area Low.
지표
RSI
Signal
+1
Multi-timeframe version of the Quantitative Qualitative Estimation (QQE) indicator.
지표
ADX
ATR
+2
GOLD SENTINEL v1.0 - A CANDLE-COLORING INDICATOR FOR GOLD.
지표
Moving Average
Support & Resistance
Adaptive, low-lag moving average designed to smooth noise while responding quickly to changing market conditions.
지표
RSI
Prop
+14
Unlock Stochastic RSI PRO in cTrader! Overlay RSI, highlight zones, and identify divergences with customizable settings.
지표
RSI
RSI on the main chart with 45/55 momentum levels, overbought/oversold levels, averaged RSI, and multi-timeframe support.
지표
ATR
BOS
+5
Opening ranges, dynamic trend channels, and multi-scale breakout/retest analysis for clear intraday chart decisions.
지표
AI
Prop
+7
EMA Clouds, Multi-Timeframe (MTF) Overlay, Swing High/Low detection, and a smart Dashboard with neutral zone filtering.
지표
Volume
Imbalance
+1
Volume profile indicator that auto-detects the latest trendline. Shows POC, Value Area (VAH/VAL), and High Volume Nodes
지표
Prop
Scalping
Shows bars from different Time Frame on zoom out and hides the current bars. Perfect tool for Multi TF "Market Reply"
지표
Supertrend
Moving Average
Easy Trade: Trend & Breakout Indicator for cTrader
지표
ATR
RSI
+17
Turn data into precision trades with AlphaTrend Pro Max — advanced trend, signal & structure analysis in one.
지표
Forex
Crypto
+5
ICT Order Block Advanced
지표
AI
ATR
+10
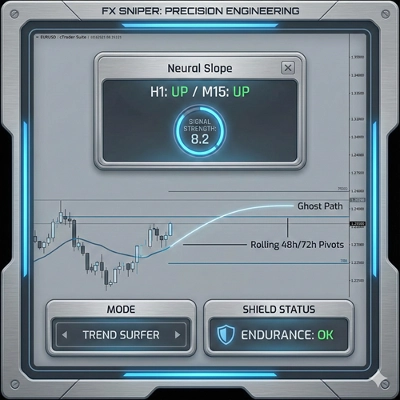
FX Sniper: Multi-pair Forex analysis tool. Features trend logic, adaptive pivots, and momentum filtering for major pairs
지표
ATR
BTCUSD
+5
Multi-pole Gaussian filter channel with dynamic color, Reduced Lag & Fast Response modes. Port of DonovanWall's original
지표
RSI
BTCUSD
+5
Identify market structure effortlessly with swing highs, lows, CHoCH, and BOS levels for smart trading decisions! 📊🔍"
지표
ATR
Volume
+2
Heatmap Liquidity Zones Visualize volume-at-price, uncover hidden support/resistance, and track market liquidity in real

가격

12.28M
거래량
31.27K
핍 수익