
설명
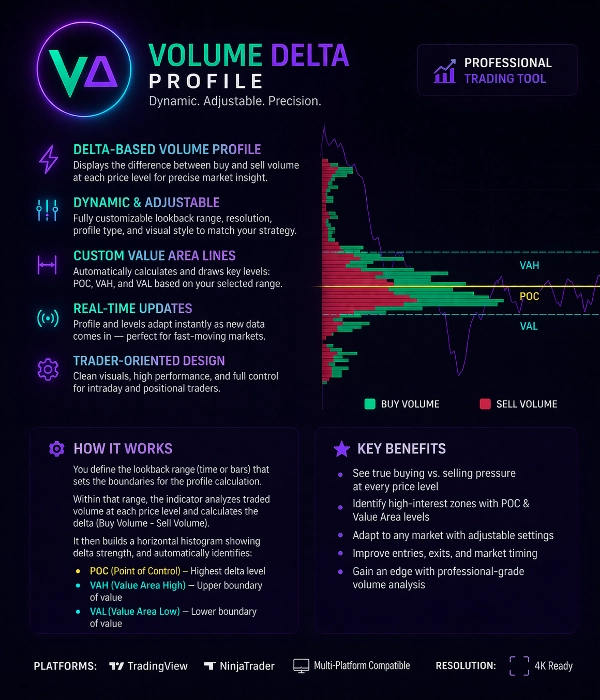
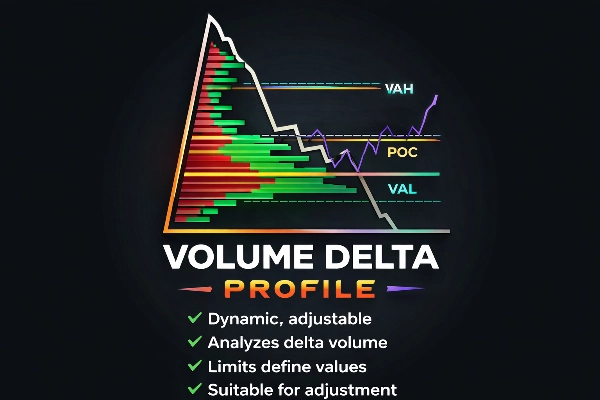
볼륨 델타 프로필
고급 트레이더를 위한 전문 주문 흐름 인사이트
볼륨 델타 프로필은 각 가격대에서 매수자와 매도자 간의 진정한 균형을 드러내도록 설계된 강력한 거래 도구입니다.
기존의 볼륨 프로필과 달리, 이 지표는 델타 볼륨(매수 볼륨 – 매도 볼륨)을 분석하여 공격적인 시장 참여자가 어디에서 우위를 점하고 있는지 보여줍니다.
트레이더가 기관 활동, 흡수 구역 및 높은 관심 가격대를 정확하게 식별하는 데 도움을 줍니다.
핵심 기능
델타 기반 볼륨 프로필
이 지표는 각 가격대에서 볼륨 델타를 계산하여 다음을 구분합니다:
• 공격적인 매수 압력
• 공격적인 매도 압력
이를 통해 누가 실제로 시장을 지배하는지를 알 수 있습니다.
동적 및 조정 가능한 프로필 범위
프로필 계산 범위는 완전히 사용자 정의 가능합니다.
사용자는 다음을 통해 계산 영역을 정의할 수 있습니다:
• 사용자 지정 바 범위
• 세션 범위
• 수동 선택
• 롤링 동적 범위
프로필은 새로운 데이터가 도착할 때마다 자동으로 업데이트됩니다.
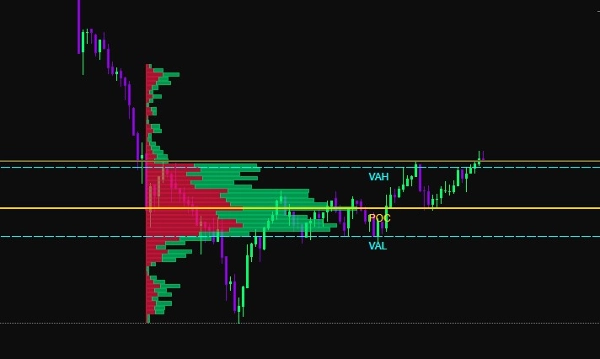
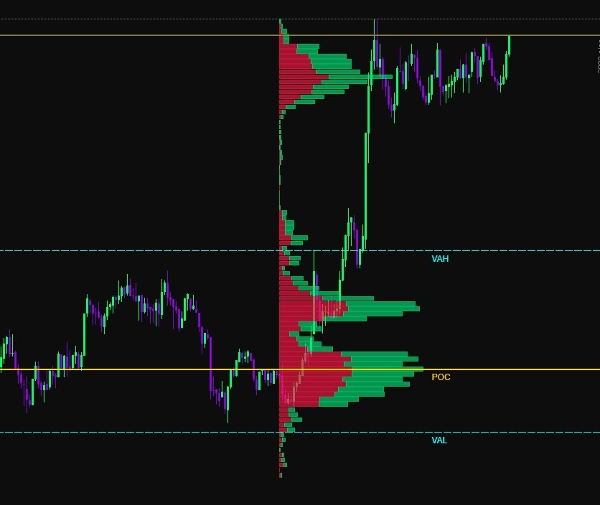
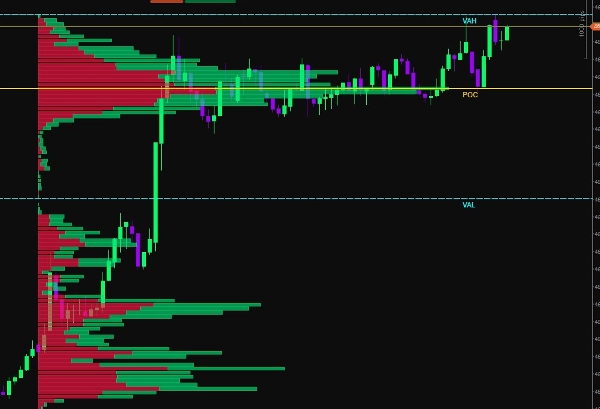
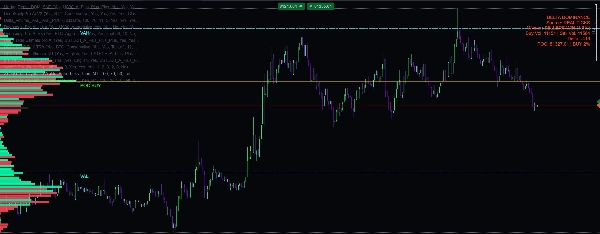
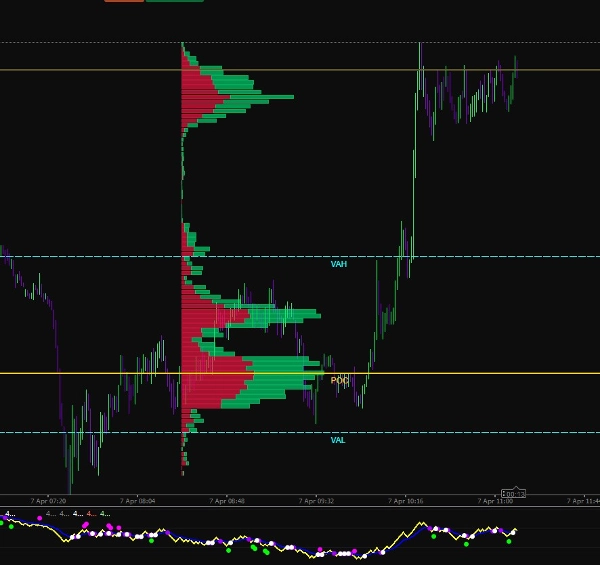
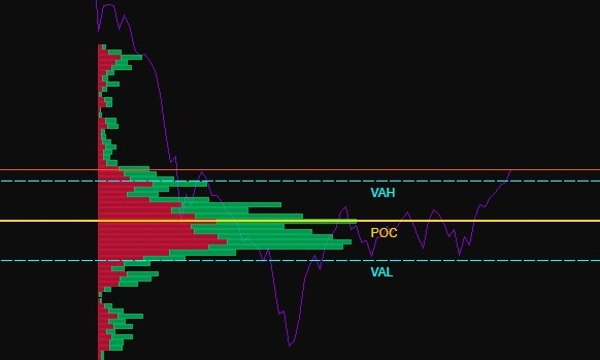
가치 영역 감지
이 지표는 주요 시장 구조 수준을 자동으로 계산합니다:
POC (통제점)
가장 높은 거래 델타 볼륨이 있는 가격대.
VAH (가치 영역 상한)
가치 영역의 상한선.
VAL (가치 영역 하한)
가치 영역의 하한선.
이 수준들은 대부분의 시장 활동이 발생한 위치를 강조합니다.
매수 대 매도 시각화
볼륨은 수평 히스토그램으로 표시됩니다:
녹색 막대 → 우세한 매수 볼륨
빨간 막대 → 우세한 매도 볼륨
이를 통해 트레이더는 즉시 다음을 확인할 수 있습니다:
• 흡수 구역
• 불균형 영역
• 유동성 클러스터
• 기관 발자국
적응형 시각화
이 지표는 다양한 시각적 사용자 정의 옵션을 포함합니다:
• 조정 가능한 히스토그램 너비
• 사용자 지정 색상 구성표
• 조정 가능한 투명도
• 해상도 제어
• 줌 적응형 렌더링
이는 모든 차트 타임프레임에서 명확한 시각화를 보장합니다.
스마트 경계 수준
이 지표는 동적 참조 수준을 그립니다:
• POC 선
• VAH 선
• VAL 선
이 수준들은 선택된 프로필 범위에 따라 자동으로 업데이트되며 다음과 같이 사용할 수 있습니다:
• 지지 / 저항
• 평균 회귀 구역
• 돌파 확인 수준
실시간 계산
볼륨 델타 프로필은 실시간 시장 데이터를 사용하여 지속적으로 재계산됩니다.
이를 통해 트레이더는 빠른 시장 상황에서도 항상 최신 주문 흐름 정보를 확인할 수 있습니다.
사용 사례
이 도구는 다음에 이상적입니다:
• 스캘핑
• 일중 거래
• 선물 거래
• 주문 흐름 분석
• 유동성 추적
• 기관 발자국 탐지
주요 거래 이점
✔ 실제 매수 대 매도 압력 식별
✔ 흡수 및 소진 구역 감지
✔ 높은 유동성 수준 위치 파악
✔ 진입 정확도 향상
✔ 돌파 또는 반전 확인
✔ 시장 구조 이해
기술 사양
계산 방법:
델타 볼륨 = 매수 볼륨 − 매도 볼륨
프로필 유형:
수평 가격대 히스토그램
자동 수준:
POC, VAH, VAL
업데이트 모드:
실시간 동적 업데이트
사용자 설정:
• 프로필 범위
• 히스토그램 해상도
• 볼륨 스케일링
• 색상 설정
• 수준 가시성
플랫폼 호환성:
최적화된 고성능 차트 렌더링
전문 트레이더를 위해 설계됨
볼륨 델타 프로필은 기본 지표를 넘어 시장의 실제 메커니즘을 이해하고자 하는 트레이더를 위해 제작되었습니다.
볼륨 분석, 델타 계산 및 가치 영역 구조를 결합하여 시장 참여 및 유동성 분포에 대한 명확한 시각을 제공합니다.
요약
Users can customize the profile calculation range using options such as custom bar range, session range, manual selection, or rolling dynamic range, with real-time updates as new market data arrives. Key market structure levels—Point of Control (POC), Value Area High (VAH), and Value Area Low (VAL)—are automatically calculated and drawn as dynamic reference lines, useful for support/resistance, mean reversion, and breakout confirmation.
Additional features include adjustable histogram width, color schemes, transparency, resolution control, and zoom-adaptive rendering for clear visualization across all chart timeframes. The tool supports use cases like scalping, intraday trading, futures trading, order flow analysis, liquidity tracking, and institutional footprint detection. It is optimized for high-performance chart rendering and aims to provide traders with precise insights into market participation and liquidity distribution.


!["[Hamster-Coder] Pivot Points MTF" 로고](https://cdn.ctrader.com/image/webp/4c143e5a-309c-40e3-a578-f04d1e133ffa_31159)


