설명
━━━━━━━━━━━━━━━━━━━━━━━━━━━━━━━━━━━━━━━━
ATR 리스크 비주얼라이저 — 리스크
━━━━━━━━━━━━━━━━━━━━━━━━━━━━━━━━━━━━━━━━
ATR을 기반으로 한 손절매 및 이익실현 수준을 즉시 시각화합니다 — 전체 R-배수 매핑(1R부터 5R까지)과 핍 레이블 포함 — 항상 포지션 진입 전에 정의된 리스크로 거래할 수 있습니다.
─────────────────────────────
주요 기능
► ATR 기반 손절매 — SL 거리는 ATR × 설정 가능한 배수(기본값 1.5×)로 계산
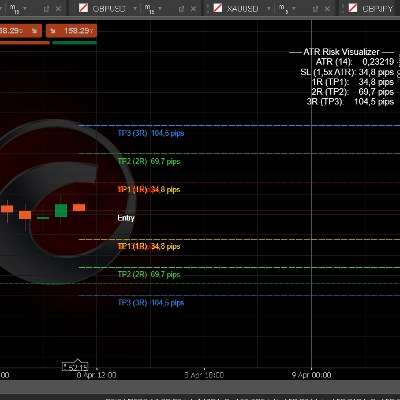
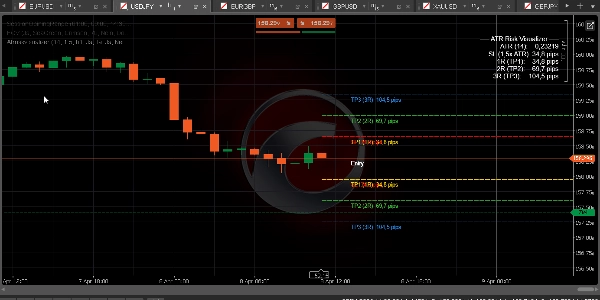
► R-배수 이익실현 — 현재 가격에서 자동으로 그려지는 TP1 (1R), TP2 (2R), TP3 (3R), TP4 (4R), TP5 (5R)
► 모든 수준에 핍 레이블 — SL 및 각 TP의 정확한 핍 거리를 한눈에 확인
► 롱 및 숏 레벨 동시 표시 — 또는 롱 전용 또는 숏 전용 모드로 전환 가능
► ATR 타임프레임 선택기 — 상위 타임프레임에서 ATR 계산 (예: M15 차트에서 H1 ATR)
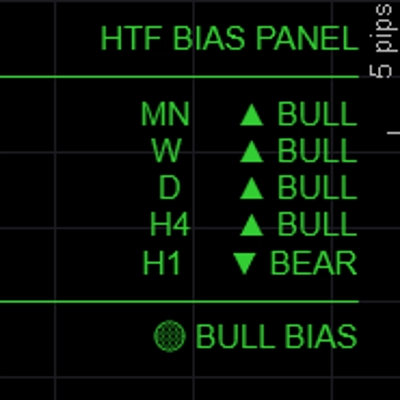
► ATR 정보 패널 (우측 상단) — ATR 값, SL 크기, TP1/2/3 핍 단위 표시
► 완전한 색상 제어 — 네이티브 cTrader 색상 선택기를 통한 SL, TP1, TP2, TP3, TP4/5 별도 색상 설정
► 설정 가능한 선 스타일 (실선 / 대시 / 점선) 및 두께
► 진입 기준으로 매도호가 또는 매수호가 선택 — 거래 방향에 따라 선택 가능
─────────────────────────────
기본 설정
→ ATR 기간 14
→ ATR 배수 1.5× (SL = 1.5 × ATR)
→ ATR 타임프레임 H1
→ TP1/2/3 표시 ON
→ TP4/5 표시 OFF
→ 방향 모두 (롱 + 숏)
→ SL 색상 빨강
→ TP1 색상 골드
→ TP2 색상 라임그린
→ TP3 색상 도저블루
→ 선 스타일 대시
─────────────────────────────
사용 방법
1. 지표를 차트에 추가하세요
2. 전략에 맞게 ATR 기간과 배수를 설정하세요 (1.5× ATR은 외환/금 표준)
3. 부드러운 SL 크기 조정을 위해 ATR 타임프레임을 H1 또는 H4로 설정하세요
4. 차트 레이블에서 핍 값을 직접 확인하세요
5. 첫 부분 청산은 TP1 (1R), 손익분기점은 TP2 (2R), 전체 목표는 TP3 (3R)을 사용하세요
6. 완전한 SMC 진입 워크플로우를 위해 BOS/CHoCH 및 FVG 지표와 결합하세요
─────────────────────────────
적합 대상
✔ 리스크 크기를 정확히 조절해야 하는 FTMO 및 프로프 펌 트레이더
✔ 거래 관리를 위해 R-배수를 사용하는 SMC 및 ICT 트레이더
✔ 모든 타임프레임에서 외환, 금, 지수 트레이더
✔ 매 진입 전에 명확한 시각적 리스크 지도를 원하는 트레이더
✔ 포지션 크기 조절에 체계적인 접근 방식을 구축하는 모든 사람
─────────────────────────────
호환성
→ 플랫폼 cTrader (데스크톱 & 웹)
→ 자산 클래스 외환, 지수, 원자재, 암호화폐 CFD
→ 타임프레임 전체 (M1부터 MN까지)
→ 접근 권한 필요 없음
→ 계정 유형 라이브 & 데모
━━━━━━━━━━━━━━━━━━━━━━━━━━━━━━━━━━━━━━━━
요약
고객 리뷰
5 | 50 % | |
4 | 50 % | |
3 | 0 % | |
2 | 0 % | |
1 | 0 % |