
present
가입하고 첫 구매 시 $50 할인을 받으세요
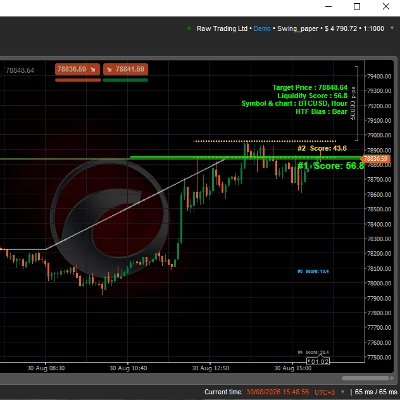
Trading product for Shadeesoflife DOL_Draw On Liquidity 지표 Double Top Fair Value Gap, image 1
Shadeesoflife DOL_Draw On Liquidity
지표
버전 1.0, Aug 2026
Windows, Mac
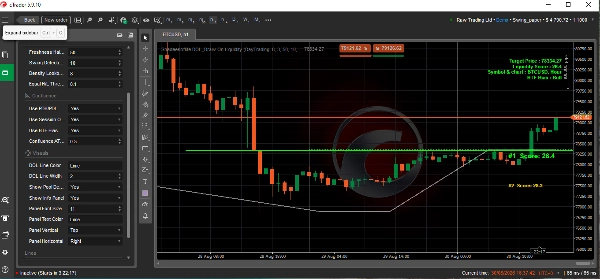
Trading product for Shadeesoflife DOL_Draw On Liquidity 지표 Double Top Fair Value Gap, image 2
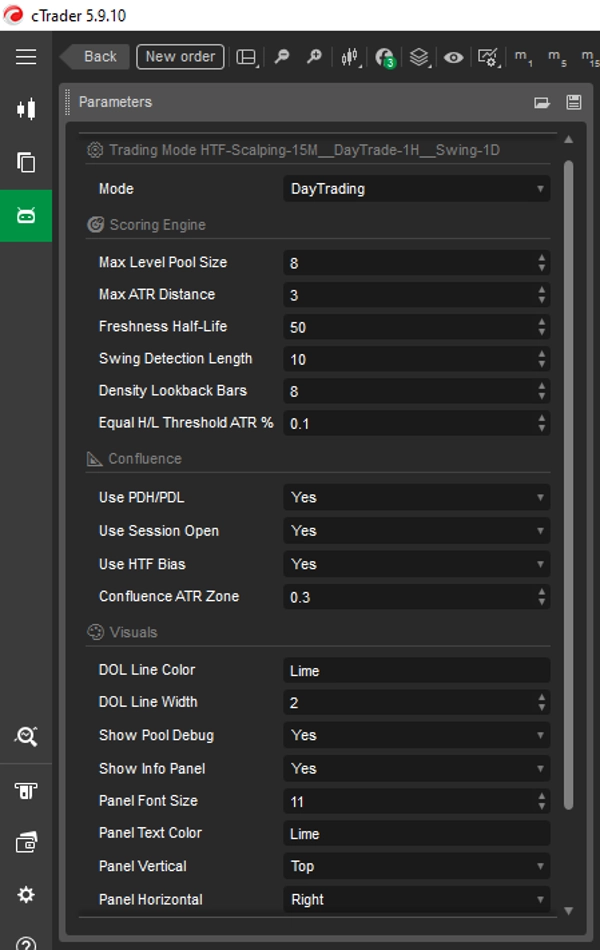
Trading product for Shadeesoflife DOL_Draw On Liquidity 지표 Double Top Fair Value Gap, image 3
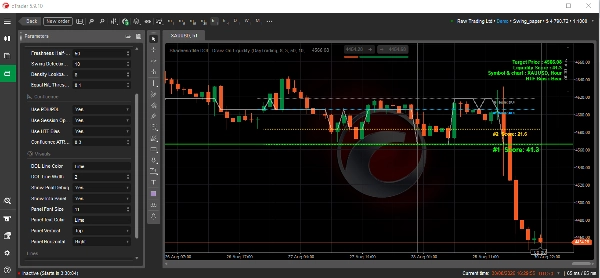
Trading product for Shadeesoflife DOL_Draw On Liquidity 지표 Double Top Fair Value Gap, image 4
Trading product for Shadeesoflife DOL_Draw On Liquidity 지표 Double Top Fair Value Gap, image 5
Trading product for Shadeesoflife DOL_Draw On Liquidity 지표 Double Top Fair Value Gap, image 6
Trading product for Shadeesoflife DOL_Draw On Liquidity 지표 Double Top Fair Value Gap, image 7
Trading product for Shadeesoflife DOL_Draw On Liquidity 지표 Double Top Fair Value Gap, image 8
Trading product for Shadeesoflife DOL_Draw On Liquidity 지표 Double Top Fair Value Gap, image 9
가입일 13/12/2025
13.66M
거래량
123.71K
핍 수익

설명

Indicator Overview

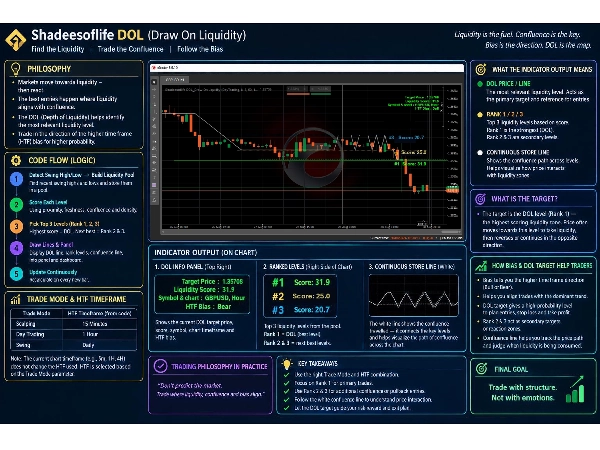
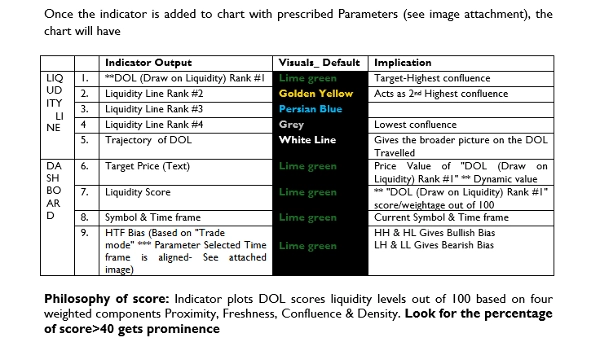
The Shadeesoflife DOL (Draw on Liquidity) cTrader indicator acts as a dynamic target-identification engine based on Smart Money Concepts (SMC) and ICT principles. It automatically detects, ranks, and tracks structural liquidity pools (swing highs/lows) across the market.

Rather than plotting static pivot points, it scores liquidity levels out of 100 based on four weighted components:

  • Proximity (35%): How close the level is to the current price (normalized by ATR).
  • Freshness (25%): How recently the pivot was formed (utilizing an exponential half-life decay).
  • Confluence (25%): Alignment with key levels (Previous Day High/Low, Session Open) and Higher Timeframe (HTF) candle direction.
  • Density (15%): Concentration of equal highs/lows near the price level, signaling clustered stop orders.

The indicator outputs a primary DOL Target (highest-scored level, shown as a prominent line) alongside an ranked pool of secondary liquidity targets, while providing an on-screen panel showing current HTF bias and target metrics.

HTF & LTF Multi-Timeframe Strategy Framework

1. Identifying Higher Timeframe (HTF) Bias and Direction

The indicator determines structural bias using the underlying TradingMode selection to reference a higher timeframe (e.g., Daily for Swing, 1-Hour for Day Trading, 15-Minute for Scalping):

  • Bullish HTF Bias:
    • Condition: The HTF candle closes higher than its open (htfBull).
    • Indicator Behavior: The scoring engine adds extra weight (+20 confluence points) to Swing Lows below the current price.
    • Trading Implication: Price is seeking sell-side liquidity (SSL) below for a discount retracement before continuing upward, or targeting buy-side liquidity (BSL) above as the ultimate expansion target.
  • Bearish HTF Bias:
    • Condition: The HTF candle closes lower than its open (htfBear).
    • Indicator Behavior: The scoring engine adds extra weight (+20 confluence points) to Swing Highs above the current price.
    • Trading Implication: Price is seeking buy-side liquidity (BSL) above for a premium retracement before moving downward, or targeting sell-side liquidity (SSL) below.

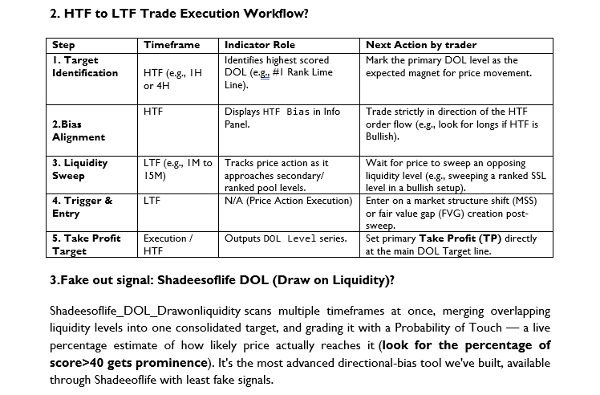
2. HTF to LTF Trade Execution Workflow

Step-1. Target Identification

Timeframe- HTF (e.g., 1H or 4H)

Indicator Role- Identifies highest scored DOL (e.g., #1 Rank Lime Line).

Action- Mark the primary DOL level as the expected magnet for price movement.

Step-2. Bias Alignment

Timeframe-HTF

Indicator Role-Displays HTF Bias in Info Panel.

Action-Trade strictly in direction of the HTF order flow (e.g., look for longs if HTF is Bullish).

Step-3. Liquidity Sweep

Timeframe-LTF (e.g., 1M to 5M)

Indicator Role-Tracks price action as it approaches secondary/ranked pool levels.

Action-Wait for price to sweep an opposing liquidity level (e.g., sweeping a ranked SSL level in a bullish setup).

Step-4. Trigger & Entry

Timeframe-LTF

Indicator Role-N/A (Price Action Execution)

Action-Enter on a market structure shift (MSS) or fair value gap (FVG) creation post-sweep.

Step-5. Take Profit Target

Timeframe-Execution / HTF

Indicator Role-Outputs DOL Level series.

Action-Set primary Take Profit (TP) directly at the main DOL Target line.

3. Execution Setup Example (Day Trading Mode)

  1. Setup: Set Mode = DayTrading (uses 1-Hour HTF and Daily reference levels).
  2. Bias: Info Panel reads HTF Bias: Bull.
  3. Primary Target: The main lime line (Rank #1 DOL) is drawn at a major swing high above current price (Buy-Side Liquidity).
  4. LTF Sweep: On the 5-minute chart, price dips downward into a secondary low-ranked target (#2 or #3 blue/gold dotted pool line near Session Open or PDL).
  5. Entry: Wait for a 5M displacement to the upside following the sweep of that secondary level. Enter long on the pullback into the newly created order block or FVG.
  6. Exit: Target the primary Rank #1 DOL line above for final take profit.

This is next generation of Draw on Liquidity.

Shadeesoflife_DOL_Drawonliquidity is an advanced market structure engine built to identify calculated Draws on Liquidity — the price level the market is most likely being pulled toward. Picking that level by eye is subjective, so DOL automates it: scanning multiple timeframes at once, merging overlapping liquidity levels into one consolidated target, and grading it with a Probability of Touch — a live percentage estimate of how likely price actually reaches it. It's the most advanced directional-bias tool we've built, available through Shadeeoflife Exclusive.


Reads multiple timeframes at once, not just one

Scans EQH/EQL, large FVGs, session boundaries, PDH/PDL, and overnight/weekend gaps

Reads session bias — patterns like Judas swings and continuations

Multi-timeframe bias table — every timeframe's read, at a glance

Probability of Touch (PoT) — a live percentage estimate of how likely the target gets hit


How is Shadeesoflife_DOL_Drawonliquidity works?

Shadeesoflife_DOL_Drawonliquidity scans Internal liquidity, External liquidity, Order Blocks, Breaker Blocks, FVGs, iFVGs, and BSL/SSL for its directional bias. DOL Pro runs on a completely different engine — it scans EQH/EQL, large FVGs, session boundaries, PDH/PDL, and overnight/weekend gaps across multiple timeframes, reads session bias like Judas swings and continuations, and grades its target with a live Probability of Touch, with much smarter algorithms. Same directional-bias mission as DOL, built on a more rigorous engine. Gives outcome of high probability setup by providing Direction and Higher Confluence target.

📊Technical Chart Breakdown

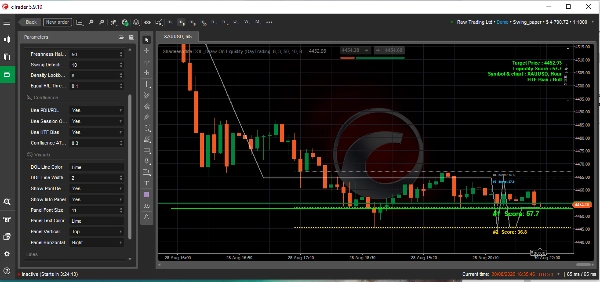
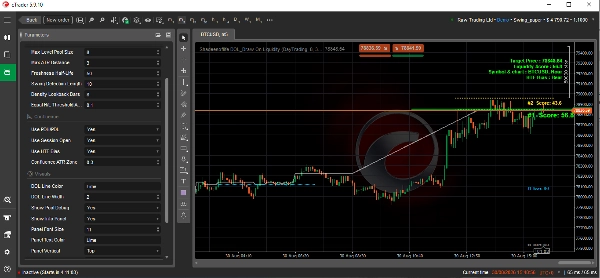
This chart from the cTrader Trading Platform displays BTCUSD (Bitcoin / US Dollar) on a 5-minute (m5) time horizon. It features a custom automated market structure indicator called Shadeesoflife DOL_Draw On Liquidity, which is configured using Smart Money Concepts (SMC).

🔎 Key Technical Metrics & Analysis

  • Current Price: The asset is trading at 78,856.48, hovering tightly within a very narrow, high-liquidity range.
  • Target Price / Draw on Liquidity (DOL): Marked by the solid bright green horizontal line at 78,848.64. This serves as a prominent magnet for price action.
  • Liquidity Score (57.3): A moderate score indicating stable but not overwhelming resting institutional orders around this pocket.
  • Higher Timeframe (HTF) Bias: Expressly labeled as Bearish (Bear). The system is looking for a continuation downward once resting buy liquidity is cleared.
  • Algorithmic Priority Scores:
    • #1 Score (57.3): Located right at the green target line.
    • #2 Score (45.8): Resting slightly higher up at the red baseline level.

💡 Core Strategic Interpretation

The indicator is mapping out a classic SMC setup where the market engine seeks to sweep specific institutional pools.

  1. The Magnet Effect: The price has pushed upward into a premium zone and is now gravitating heavily toward the green Draw on Liquidity (DOL) baseline at 78,848.64.
  2. Trend Alignment: Because the structural HTF Bias is Bearish, this local downward pull toward the DOL line aligns perfectly with the dominant trend.
  3. Liquidity Clearance: Once price targets and mitigates the resting liquidity at this green line, traders typically watch for a decisive structural break or an aggressive continuation of the macro bearish direction.

Note:

  • Use your overall portfolio risk-per-trade parameters manually for consistent profit
  • Can be used in BTCUSD, XAUUSD.
  • Above BTCUSD analysis is based on chart LTF 5m (manual selection of chart) and HTF 1D (Parameter Drop down selection).
  • The indicator can be used for
    • scalping- HTF 15M, (Default)
    • Day trade- HTF 1H,
    • Swing trade- HTF 1D,
    • Four Hour Trade- HTF 4H
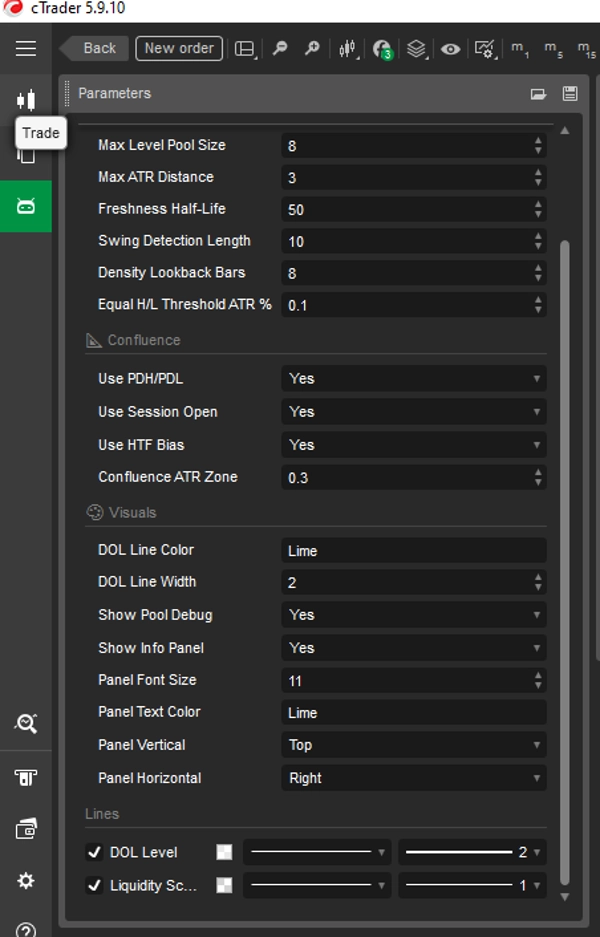
  • "Show pool debug" parameter can be used to switch off the less important Target confluence line except ranked #1.
  • "Show info panel" parameter can be used to switch off to hide the panel.
  • "Panel" can be customized with taxt size, text color & panel position(horizontal/ Vertical Position).
  • "DOL level" line position in X axis co-ordinate(Price) indicates the Ranked #1 Target confluence line at respective Y axis co-ordinate(Time)


요약

지표 프로필

고객 리뷰

0.0
리뷰: 0
고객 리뷰
이 상품에 대한 리뷰가 아직 없습니다. 이미 사용해 보셨나요? 다른 사람들에게 가장 먼저 소개해 주세요!

상담

자주 묻는 질문(FAQ)

Double Top
Fair Value Gap
Key Levels
Liquidity Sweep
Market Structure
Double Bottom
Liquidity Grab
트레이딩 봇, 지표, 플러그인 등 cTrader Store에서 제공되는 상품은 제3자 개발자에 의해 제공되며, 이는 단순히 정보 및 기술적 접근을 목적으로 제공된 것입니다. cTrader Store는 중개인이 아니며, 투자 조언, 개인별 추천 또는 향후 성과에 대한 어떠한 보장도 제공하지 않습니다.

좋아하실 만한 다른 항목

지표
SMC
Grid
+19
Smart fractals + auto Fibonacci + dynamic S/R zones with HTF confluence & Bull/Bear bias panel. Institutional-grade.
지표
AI
RSI
+7
Multi-asset screener with real-time RSI/volatility analysis, interactive dashboard, and color-coded trading signals.
지표
ATR
VWAP
+4
Structure-aware indicator that re-anchors VWAP to confirmed swing pivots.
지표
Prop
Forex
+4
It draws Pivot Levels on the chart.
지표
BOS
Order Block
+3
Not every order block deserves your attention.
지표
Prop
Forex
+13
🐠 Coral Filter X Pro turns trend detection into a simple, repeatable workflow 🐠
지표
EMA
Channel
+2
WaveTrend Oscillator implementation for cTrader based on LazyBear's popular TradingView indicator.
지표
SMC
Forex
+5
The only cTrader FVG indicator with Breakaway Gap detection, mitigation tracking, and full multi-asset compatibility.
지표
ATR
Fibonacci
+1
Trading Clock Pro: An all-in-one market timing dashboard designed to help traders understand the market at one Spot.
지표
Forex
BTCUSD
+5
Buy-Side & Sell-Side Liquidity (BSL/SSL) Indicator
지표
Signal
Indices
The **Whale Hunting Indicator** is a trading tool for **Boom & Crash and Volatility indices**, featuring **Auto Trend De
지표
Volume
Key Levels
+2
Professional Session Volume Profile for cTrader with POC, Value Area, naked levels and rich HUD.
지표
Volume
Key Levels
+1
Order book indicator .Don't trade against the flow. Trade with the truth!
지표
BOS
CHOCH
+4
Dual-track market structure detection with BVC order flow confirmation and two-stage liquidity sweep validation.
지표
Forex
BTCUSD
+11
📈 Adaptive ALMA-Gaussian hybrid trend filter with precision smoothing and clear buy/sell signals.
지표
Forex
Real-Time Candlestick Pattern Detection with Custom Alerts & Trend Analysis for cTrader
지표
Order Block
Fair Value Gap
+1
This indicator contains most of the ICT strategies that you need. You can turn on/off each one to be shown.
지표
Volume
Fibonacci
+3
Draw and manage multiple fixed-range volume profiles with persistent levels, developing POC/VA and smart alerts.

가격

가입일 13/12/2025
13.66M
거래량
123.71K
핍 수익

















