present
Zarejestruj się i otrzymaj 50 $ zniżki na pierwszy zakup
Trading product for Daily Open Color Zones Pro_noSourceCode Wskaźnik Scalping, image 1
Daily Open Color Zones Pro_noSourceCode
Wskaźnik
Wersja 1.0, Sep 2025
Windows, Mac
Trading product for Daily Open Color Zones Pro_noSourceCode Wskaźnik Scalping, image 2
Trading product for Daily Open Color Zones Pro_noSourceCode Wskaźnik Scalping, image 3
Trading product for Daily Open Color Zones Pro_noSourceCode Wskaźnik Scalping, image 4
Trading product for Daily Open Color Zones Pro_noSourceCode Wskaźnik Scalping, image 5
Od 13/09/2025
30
Sprzedaż
6.74K
Bezpłatne instalacje

Opis

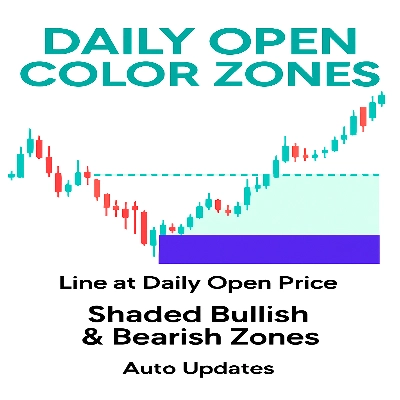
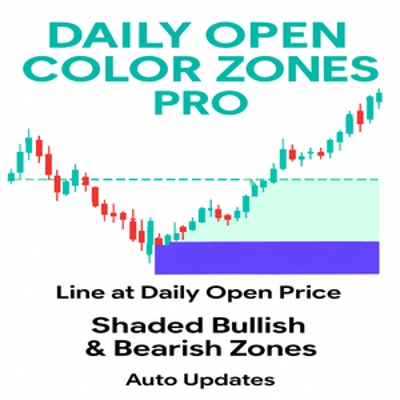
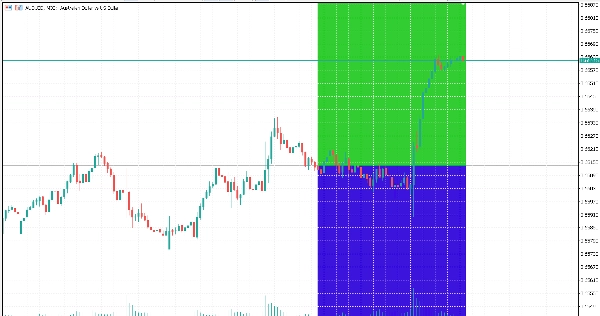
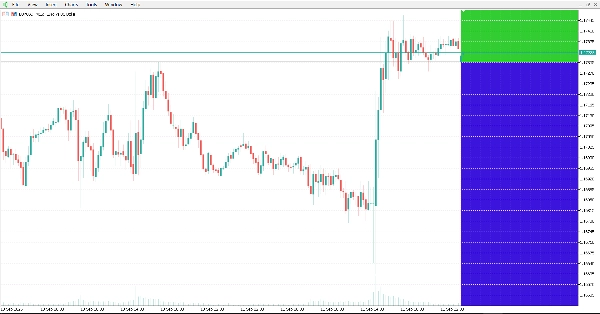
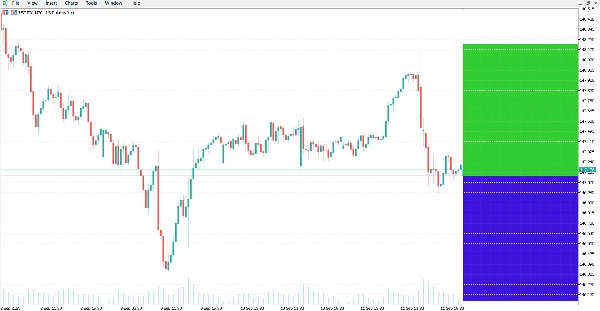
Ten wskaźnik to profesjonalne narzędzie zaprojektowane do rysowania Linii Otwarcia Dnia i natychmiastowego zacieniania byczych i niedźwiedzich stref cenowych wokół niej. Zamiast pozostawiać traderów w niepewności, dostarcza wyraźną wizualną mapę nastrojów rynkowych od samego początku dnia. Jego celem jest pomoc w natychmiastowym rozpoznaniu, czy rynek handluje powyżej czy poniżej otwarcia dnia — kluczowego punktu odniesienia dla strategii intraday.

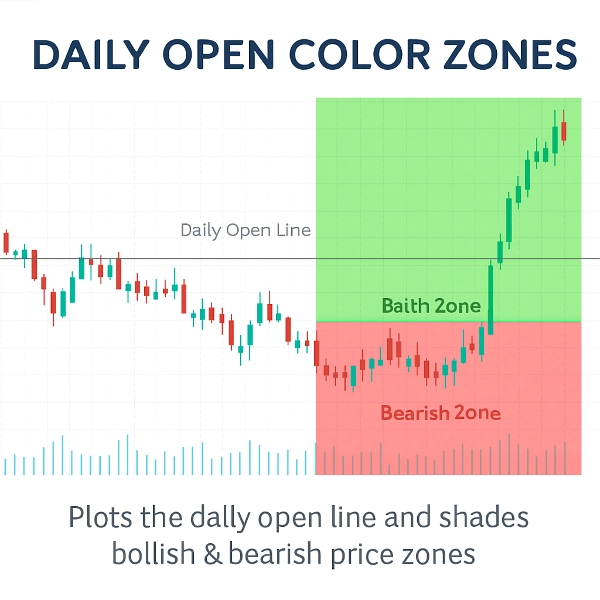
Wskaźnik automatycznie rysuje poziomą linię na cenie otwarcia dnia i zacienia wykres:

Zielona Strefa powyżej linii dla byczego terytorium.

Czerwona Strefa poniżej linii dla niedźwiedziego terytorium.

Ten prosty, a zarazem potężny wizualny sygnał pomaga traderom szybko ocenić nastawienie, dostrzec potencjalne odwrócenia i dopasować transakcje do dominującego kierunku rynku.

Funkcje

Automatyczna Linia Otwarcia Dnia: Rysuje dokładną cenę otwarcia dnia z precyzją.

Wyraźne Strefy Kolorów: Natychmiast rozróżnia bycze i niedźwiedzie obszary za pomocą konfigurowalnych kolorów i przezroczystości.

Dynamiczne Aktualizacje: Strefy automatycznie dostosowują się z każdą nową świecą i powiększeniem wykresu.

Konfigurowalny Wygląd: Zmień styl linii, grubość i kolory stref, aby dopasować je do motywu wykresu.

Lekki i Szybki: Optymalizowany pod kątem minimalnego zużycia CPU, nawet na kontach na żywo z dużymi zbiorami danych.

Działa na Wszystkich Symbolach i Interwałach: Od forexu po surowce, indeksy i kryptowaluty.

Dlaczego go używać? Otwarcie dnia to jeden z najbardziej obserwowanych poziomów cen przez profesjonalnych traderów. Poprzez wizualne oddzielenie byczych i niedźwiedzich stref, ten wskaźnik daje natychmiastowy odczyt nastrojów rynkowych, pomagając podejmować szybsze i pewniejsze decyzje handlowe.

Podsumowanie To nie jest tylko linia na twoim wykresie — to wizualna przewaga handlowa. Niezależnie czy skalpujesz, handlujesz dziennie, czy swingowo, wskaźnik Daily Open Color Zones utrzyma cię przy jednym z najważniejszych poziomów cen dnia.


Podsumowanie

Podsumowanie AI
The Daily Open Color Zones Pro indicator automatically plots the daily open price as a horizontal line on trading charts and visually distinguishes bullish and bearish price zones around it. The area above the daily open line is shaded green to indicate bullish territory, while the area below is shaded red for bearish territory. This dynamic shading updates with each new candle and adjusts to chart zoom levels, providing a clear visual representation of market sentiment from the start of the trading day. Users can customize the line style, thickness, and zone colors to fit their chart preferences. The indicator is optimized for low CPU usage and supports all symbols and timeframes, including forex, commodities, indices, and cryptocurrencies. It is designed to help traders quickly assess market bias, identify potential reversals, and align trades with prevailing intraday trends, making it suitable for scalping and other intraday strategies.
Profil wskaźnika

Opinie klientów

0.0
Opinie: 0
Opinie klientów
Ten produkt nie ma jeszcze opinii. Wypróbowałeś(-aś) go już? Bądź pierwszy(-a) i powiedz o tym innym!

Dyskusja

Częste pytania

Scalping
Produkty dostępne za pośrednictwem cTrader Store, w tym boty handlowe, wskaźniki i wtyczki, dostarczane są przez deweloperów zewnętrznych i udostępniane wyłącznie w celach informacyjnych oraz w celu zapewnienia dostępu technicznego. cTrader Store nie jest brokerem i nie zapewnia doradztwa inwestycyjnego, nie udziela spersonalizowanych rekomendacji ani nie gwarantuje przyszłych wyników.

Więcej od tego autora

Logo „Super trend X”
Najwyżej oceniane
4.2
(4)
Za darmo
cBot
AI
ATR
+15
SuperTrend X cBot is a fully automated trading robot for cTrader built entirely on the power of the SuperTrend indicator
Logo „Strategy EMA 21”
Statystyki na żywo
4.0
(1)
Za darmo
cBot
ATR
RSI
+12
EMA 21 13 8 Scalper is a fully automated trading system that captures intraday momentum with clarity and discipline
Wskaźnik
AI
ATR
+13
Stop Loss Pro – Precision Risk Management for Every Trader
cBot
AI
RSI
+8
Spectral Frequency Engine — AI-Driven FFT cbot for EUR/USD (M5)
Wskaźnik
ATR
Grid
+11
Download Ultimate Trend ADX today and experience a smarter way to track market trends completely free on ctrader
Wskaźnik
Grid
Forex
+4
indicator showing the Daily Open Line and instantly shading bullish and bearish zones.
Wskaźnik
AI
ATR
+13
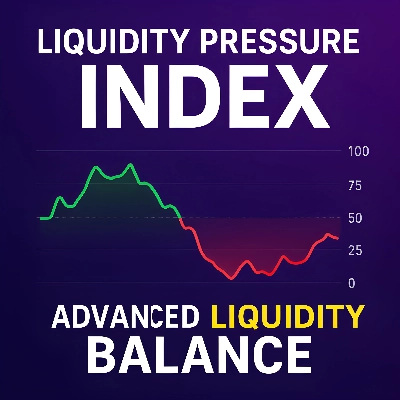
Liquidity Pressure Index is a tool that gives traders deeper insights into the hidden dynamics of market liquidity
Wskaźnik
AI
MACD
+10
Measure Market Strength at a Glance – Instantly
Wskaźnik
RSI
Grid
+7
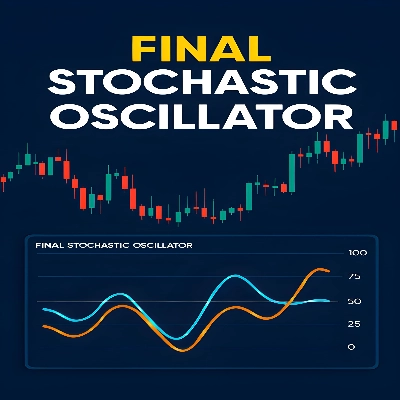
Final Stochastic Oscillator is a next-generation upgrade of the classic stochastic indicator
Wskaźnik
ATR
RSI
+13
is a trend-following indicator designed to provide a clear view of market direction, momentum, and strength
Wskaźnik
ATR
RSI
+8
The Candle Pressure Index is a powerful, user-friendly indicator that reveals hidden market pressure inside candles.
Wskaźnik
MACD
Forex
+6
BullBear Dynamics helps traders detect and interpret the balance between bullish and bearish momentum

Możesz także polubić

Wskaźnik
Forex
Signal
+1
Innovative indicator that highlights trend direction and momentum strength quickly and clearly on Forex charts.
Wskaźnik
Crypto
Signal
+3
Candlestick Signal Finder: cTrader indicator that automatically detects and color-codes key Japanese candlestick pattern
Wskaźnik
ATR
RSI
+4
RSI bands drawn on price, confluence-scored BUY/SELL signals, an ATR stop with three targets
Wskaźnik
Track major trading sessions (Tokyo, London, New York) with customizable colors and visual session highlights on your ch
Wskaźnik
Bollinger
Complete MA-channel system: colored trend, channel boundaries & equilibrium with 6 Fib zones.
Logo „IVB 2.0”
Najwyżej oceniane
4.6
(5)
$19
Wskaźnik
IVB 2.0 is an indicator that works on the strategy of imbalance of the maximum volatility box of indices
Wskaźnik
RSI
MACD
This indicator is a combination of MACD and RSI into one. This is perfect fusion and powerful indicator ever.
Wskaźnik
VWAP
Volume
+5
The MA Quant Volume Profile Custom Range is a trading indicator that analyzes volume distribution across the price.
Wskaźnik
ADX
ATR
+5
Ten confluence layers scored on every closed bar, with an anti-chop gate, pivot levels and a live dashboard.
Wskaźnik
Volume
Custom range volume profile between two draggable anchors. Auto source timeframe, Total/Up-Down/Delta, POC, Value Area.
Wskaźnik
SMC
Prop
+12
Multi-TF FVG + Smart Fibonacci
Wskaźnik
Forex
Crypto
+3
PnL dashboard with per‑asset exposure, win‑rate, and spread % with dynamic colors.
Wskaźnik
Prop
Forex
+13
Volume Meter
Logo „ATR Bands”
Popularne
4.7
(4)
$19
Wskaźnik
ATR
Prop
+13
Enhance trading with ATR Bands! Visualize market volatility using dynamic upper and lower ATR bands for precise decision
Wskaźnik
ATR
BTCUSD
+5
Trailing algo 📈 auto-tracks trends 🎯 adapts to volatility 🌟 precise moves 🛡️ retest signals 🚀 no lag, smart market
Wskaźnik
ATR
BOS
+5
Know how strong each Supertrend flip is: scored BUY/SELL, structure stop + 3 targets, live win-rate dashboard, alerts.
Wskaźnik
ATR
Prop
+14
Optimize exits with Chandelier Exit! Visualize stop-loss points dynamically for improved trading precision and safety.
Wskaźnik
Breakout
Institutional Flow Radar scans the chart for abnormal volume events and classifies them into two groups: Capital &Public

Cena

Od 13/09/2025
30
Sprzedaż
6.74K
Bezpłatne instalacje