Penerangan
📈 Penunjuk Bias Volatiliti Skew – Versi Profesional (untuk cTrader)
Buka pemahaman yang lebih mendalam tentang tekanan pasaran, ketidakseimbangan volatiliti, dan keyakinan arah dengan Penunjuk Bias Volatiliti Skew, versi dipertingkatkan bagi pendekatan berasaskan volatiliti klasik yang asalnya diinspirasikan oleh Pine Script dan kini dioptimumkan sepenuhnya untuk cTrader.
Alat ini membantu pedagang memvisualisasikan bahagian pasaran mana yang memberi kesan lebih kuat — pembeli atau penjual — dengan mengukur ketidaksimetrian volatiliti dan menukarnya kepada isyarat yang jelas dan mudah dibaca.
Sama ada anda berdagang indeks, forex, komoditi atau kripto, penunjuk ini berfungsi sebagai penapis tren, pengesan rejim, dan alat pengesahan bias yang berkuasa.
1. Apa yang Diukur oleh Penunjuk Skew
Penunjuk ini menilai imbangan volatiliti antara lilin bullish dan bearish.
Ia mengira Julat Benar yang dinormalisasi dan memasukkannya ke dalam dua purata adaptif:
- Penyimpangan Maksimum → volatiliti yang dihasilkan semasa lilin naik
- Penyimpangan Minimum → volatiliti yang dihasilkan semasa lilin turun
Kemudian ia mengira:
👉 Skew = DeviationMax / DeviationMin
Ini menukar volatiliti mentah kepada bacaan arah yang jelas:
- Skew > 1 → pergerakan ke atas lebih kuat secara purata
- Skew < 1 → pergerakan ke bawah lebih kuat
- Skew ≈ 1 → volatiliti adalah simetri dan pasaran seimbang
Ringkasnya:
Skew mendedahkan sebelah mana yang mempunyai “dominasi volatiliti”.
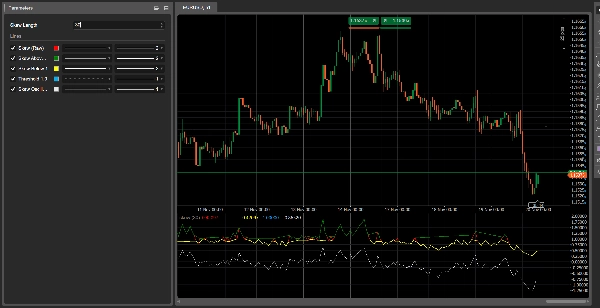
2. Memahami Garis-garis
1. Skew (Mentah) – Garis Merah
Nisbah volatiliti tulen. Ini adalah isyarat utama.
2. Skew Di Atas 1 – Garis Hijau
Menunjukkan dominasi volatiliti bullish.
3. Skew Di Bawah 1 – Garis Kuning
Menunjukkan dominasi volatiliti bearish.
4. Garis Ambang 1.0 – Garis bertitik Biru
Mewakili keseimbangan.
5. Osilator Skew (log) – Garis Putih
Perwakilan yang lebih stabil dan lancar:
- di atas 0 = volatiliti bullish
- di bawah 0 = volatiliti bearish
3. Cara Membacanya
A) Rejim Pasaran
🔹 Rejim Bullish
- Skew > 1
- Garis hijau aktif
- Osilator di atas sifar
→ Pasaran memihak kepada long.
🔹 Rejim Bearish
- Skew < 1
- Garis kuning aktif
- Osilator di bawah sifar
→ Pasaran memihak kepada short.
🔹 Neutral
- Skew ≈ 1
→ Pasaran seimbang, sesuai untuk perdagangan julat.
4. Isyarat Peralihan Rejim
Skew melintasi ke atas 1
→ Pembeli memperoleh dominasi volatiliti
→ Peralihan bullish
Skew melintasi ke bawah 1
→ Penjual memperoleh dominasi volatiliti
→ Peralihan bearish
Peralihan ini sering berlaku sebelum tindakan harga mengesahkan tren, menjadikan Skew penunjuk awal yang berkuasa.
5. Kes Penggunaan Praktikal
1️⃣ Penapis Tren untuk cBots
- berdagang long hanya apabila SkewOsc > 0
- berdagang short hanya apabila SkewOsc < 0
2️⃣ Pengesahan Kualiti Tren
- Uptrend + Skew > 1 = tren kuat
- Uptrend + Skew menurun ke arah 1 = tren melemah
3️⃣ Sentimen Pasaran / Penapis Risiko
Sangat berkesan pada indeks dan pasangan utama FX.
6. Ringkasan
- Apa yang ditunjukkan: dominasi volatiliti
- Mengapa ia penting: peralihan volatiliti mendahului peralihan harga
- Cara menggunakannya: sebagai penapis, alat pengesahan, atau pengukur sentimen
- Bahagian terbaik: sangat ringan, pantas, dan mudah disesuaikan
Ringkasan
Ulasan pelanggan
5 | 67 % | |
4 | 33 % | |
3 | 0 % | |
2 | 0 % | |
1 | 0 % |


